Florida B.E.S.T. MA.912.DP.1
B.E.S.T. Standard (Benchmark Cluster)
Summarize, represent and interpret categorical and numerical data with one and two variables.
Florida B.E.S.T. Standards for Mathematics
Cluster contents
Benchmarks in This Standard
MA.912.DP.1 is a B.E.S.T. standard. These are the benchmarks under it.
- MA.912.DP.1.1
Given a set of data, select an appropriate method to represent the data, depending on whether it is numerical or categorical data and on whether it is univariat...
- MA.912.DP.1.2
Interpret data distributions represented in various ways. State whether the data is numerical or categorical, whether it is univariate or bivariate and interpre...
- MA.912.DP.1.3
Explain the difference between correlation and causation in the contexts of both numerical and categorical data.
- MA.912.DP.1.4
Estimate a population total, mean or percentage using data from a sample survey; develop a margin of error through the use of simulation.
- MA.912.DP.1.5
Interpret the margin of error of a mean or percentage from a data set. Interpret the confidence level corresponding to the margin of error.
Teacher's field guide
What This Cluster Means
What Students Need to Do
- Students organize data in tables, graphs, and numerical summaries. They choose a suitable display, then describe patterns, differences, spread, and relationships without claiming more than the data show.
What Mastery Looks Like
- A student can create and read frequency tables, bar graphs, histograms, box plots, scatter plots, and two-way tables. They use measures such as median, mean, range, and IQR to compare groups and describe relationships.
Common Misconceptions
- Students often use bar graphs for numerical data or histograms for categories. They may confuse association with causation, ignore outliers, or compare graphs with different scales as if the scales match.
How to Assess It
- Exit ticket: Give students commute method and commute time for 12 students. Ask them to sketch a suitable display and write two observations supported by the data.
Lesson moves
Ways to Teach It
Collect each student's shoe type and shoe length, then build a frequency table and side-by-side dot plots on chart paper.
Show two graphs of the same data with different scales; ask which is more honest and require three numerical details.
Run a display-match relay where teams pair dataset cards with bar graphs, histograms, box plots, or scatter plots and justify each match.
Use local weather data to compare monthly temperatures across two years and describe center, spread, outliers, and association.
Free download
Printable MA.912.DP.1 Worksheet
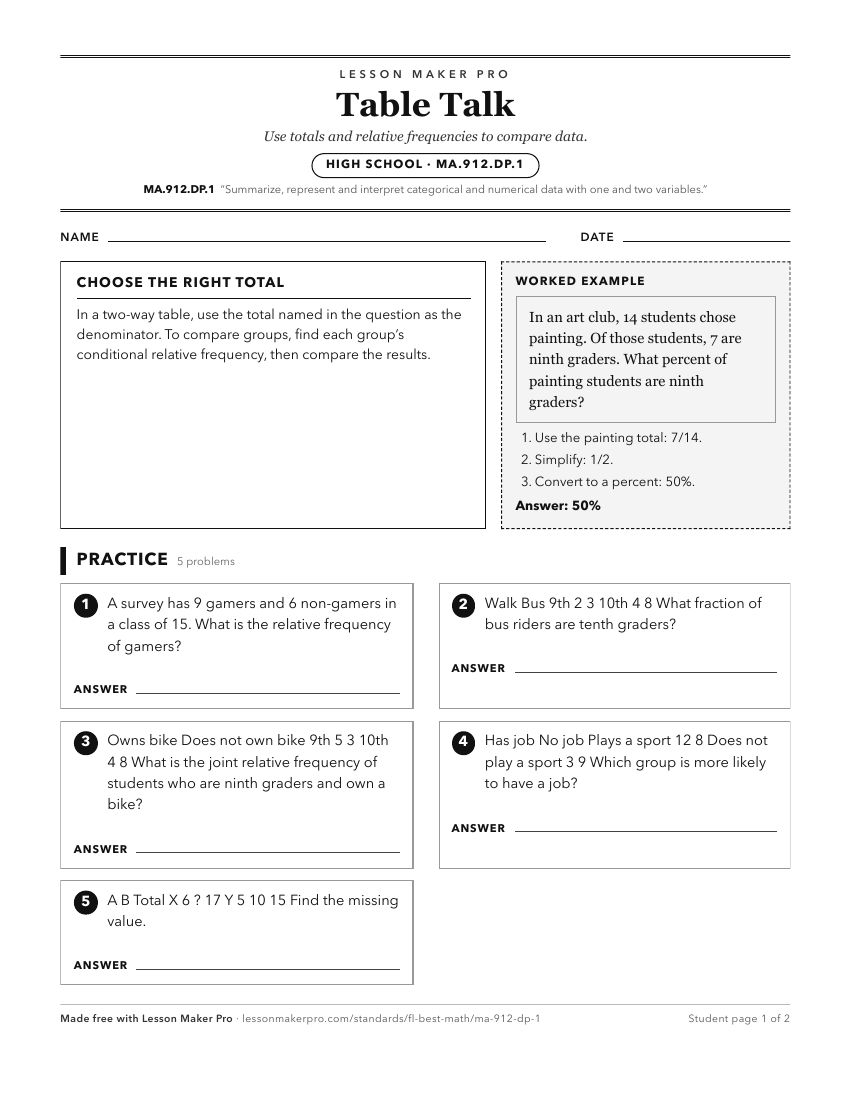
A ready-to-print activity worksheet aligned to MA.912.DP.1, with an answer key for the teacher on its own page. No account needed.
PDF, US Letter, prints cleanly in black and white.
Download the worksheetKeep exploring
Related Standards
Turn this cluster into a lesson
Grade, subject, topic, and the complete cluster are prefilled. Create one free, no account needed.
Also for this cluster:Make a WorksheetMake a QuizMake a Sub Lesson