Florida B.E.S.T. MA.912.DP.1.3
The Standard
Explain the difference between correlation and causation in the contexts of both numerical and categorical data.
Florida B.E.S.T. Standards for Mathematics
Teacher's field guide
What This Standard Means
What Students Need to Do
- Students describe relationships shown in numerical data and categorical data. They decide whether the evidence shows only an association or supports a cause-and-effect claim, and explain why.
What Mastery Looks Like
- Students can read a scatterplot or two-way table and describe the relationship shown. They can state whether a causal claim is supported and name possible confounding variables when it is not.
Common Misconceptions
- Students may think a strong pattern proves that one variable causes the other. They may reverse the direction of cause or ignore a third variable. They may also assume large group differences from a survey support a causal claim.
How to Assess It
- Give this exit ticket: “A survey finds students who sleep longer earn higher test scores. Can the school conclude that more sleep causes higher scores? Explain.”
Lesson moves
Ways to Teach It
Give groups claim cards and study descriptions to sort into association only or causal evidence, then require one written reason per card.
Ask students to explain why ice cream sales and sunburn cases rise together without claiming that either causes the other.
Run a matching game pairing scatterplots and two-way tables with valid association statements, invalid causal claims, and possible confounding variables.
Compare health or advertising headlines with the studies behind them, then rewrite each headline to match what the data actually supports.
Free download
Printable MA.912.DP.1.3 Worksheet
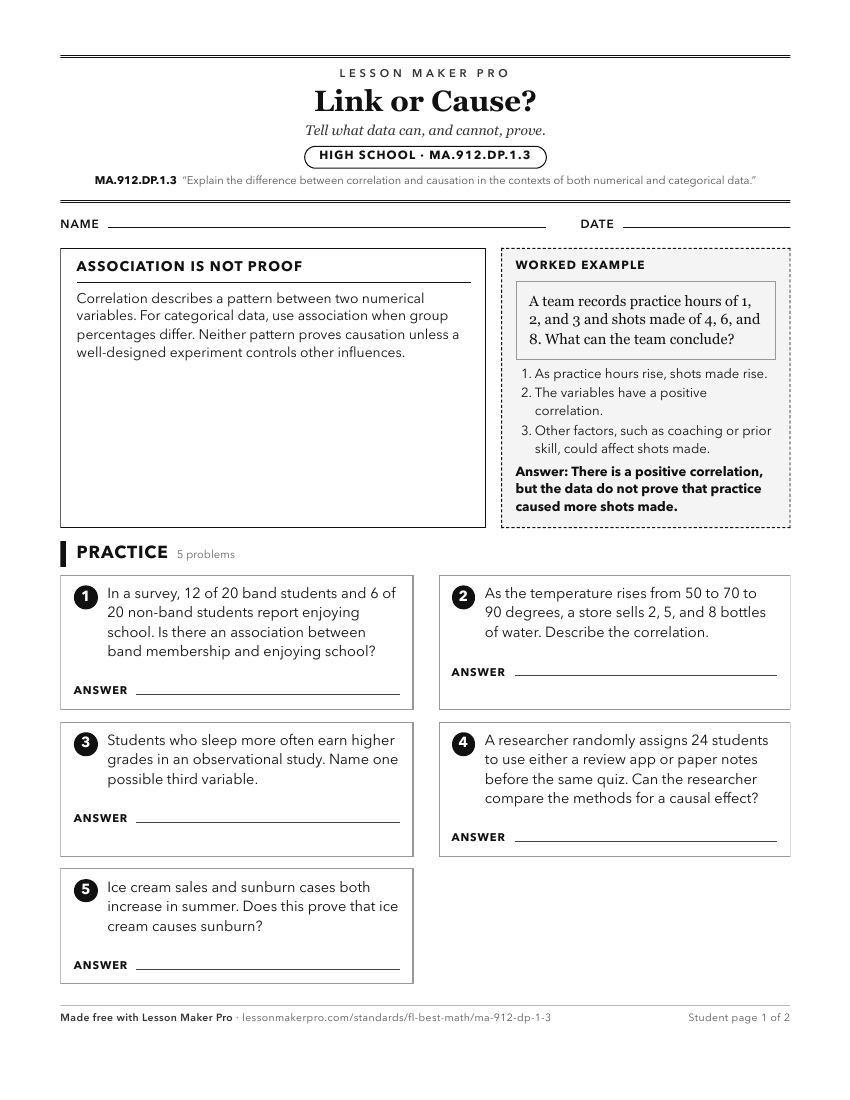
A ready-to-print activity worksheet aligned to MA.912.DP.1.3, with an answer key for the teacher on its own page. No account needed.
PDF, US Letter, prints cleanly in black and white.
Download the worksheetKeep exploring
Related Standards
- MA.912.DP.3.5
Solve real-world problems involving univariate and bivariate categorical data.
- MA.912.DP.1.1
Given a set of data, select an appropriate method to represent the data, depending on whether it is numerical or categorical data and on whether it is univariat...
- MA.912.DP.1
Summarize, represent and interpret categorical and numerical data with one and two variables.
- MA.912.DP.3
Solve problems involving categorical data.
Turn this exact standard into a lesson
Grade, subject, topic, and the complete standard are prefilled. Create one free, no account needed.
Also for this standard:Make a WorksheetMake a QuizMake a Sub Lesson