Florida B.E.S.T. MA.912.DP.3.5
The Standard
Solve real-world problems involving univariate and bivariate categorical data.
Florida B.E.S.T. Standards for Mathematics
Teacher's field guide
What This Standard Means
What Students Need to Do
- Students organize category data in frequency tables and two-way tables. They calculate counts, relative frequencies, and conditional percentages, then use the results to answer questions and compare groups.
What Mastery Looks Like
- Students correctly organize categories and frequencies in a table. They choose the right total for a percentage, compare groups fairly, and explain what the results mean in context.
Common Misconceptions
- Students often compare raw counts when group sizes differ. They confuse joint, marginal, and conditional frequencies, or divide by the grand total instead of a row or column total. They may claim an association proves causation.
How to Assess It
- Exit ticket: Of 40 bus riders, 26 arrive on time. Of 60 car riders, 30 arrive on time. Find each on-time percentage and identify the group with the higher rate.
Lesson moves
Ways to Teach It
Give pairs 30 colored cards showing pet type and housing type, then have them build a two-way table and compare percentages.
Post two school-club graphs with unequal group sizes and ask, “Should we compare counts or percentages, and why?”
Play Table Relay: teams complete missing cells in two-way tables, calculate one requested percentage, and explain which denominator they used.
Use cafeteria survey data on lunch choice and grade level to decide which meal needs more servings for each grade.
Free download
Printable MA.912.DP.3.5 Worksheet
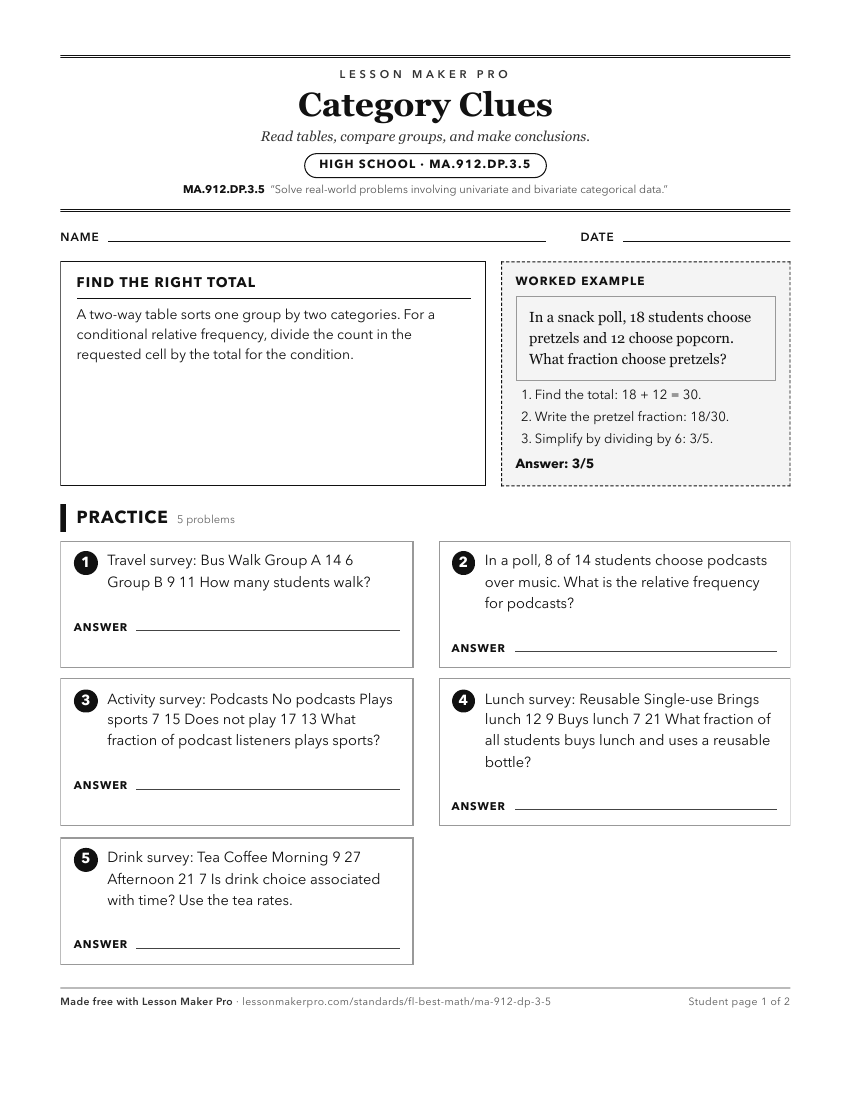
A ready-to-print activity worksheet aligned to MA.912.DP.3.5, with an answer key for the teacher on its own page. No account needed.
PDF, US Letter, prints cleanly in black and white.
Download the worksheetKeep exploring
Related Standards
Turn this exact standard into a lesson
Grade, subject, topic, and the complete standard are prefilled. Create one free, no account needed.
Also for this standard:Make a WorksheetMake a QuizMake a Sub Lesson