Florida B.E.S.T. MA.912.DP.3
B.E.S.T. Standard (Benchmark Cluster)
Solve problems involving categorical data.
Florida B.E.S.T. Standards for Mathematics
Cluster contents
Benchmarks in This Standard
MA.912.DP.3 is a B.E.S.T. standard. These are the benchmarks under it.
- MA.912.DP.3.1
Construct a two-way frequency table summarizing bivariate categorical data. Interpret joint and marginal frequencies and determine possible associations in term...
- MA.912.DP.3.2
Given marginal and conditional relative frequencies, construct a two-way relative frequency table summarizing categorical bivariate data.
- MA.912.DP.3.3
Given a two-way relative frequency table or segmented bar graph summarizing categorical bivariate data, interpret joint, marginal and conditional relative frequ...
- MA.912.DP.3.4
Given a relative frequency table, construct and interpret a segmented bar graph.
- MA.912.DP.3.5
Solve real-world problems involving univariate and bivariate categorical data.
Teacher's field guide
What This Cluster Means
What Students Need to Do
- Students organize and analyze data made of categories, such as grade level, survey response, or product choice. They use counts, proportions, tables, and graphs to compare groups and solve problems. They interpret associations without claiming unsupported cause and effect.
What Mastery Looks Like
- Students organize categorical data in tables or graphs and calculate accurate counts, proportions, and conditional percentages. They compare groups and explain any association using the data and the problem context.
Common Misconceptions
- Students may compare raw counts when group sizes differ, rather than using percentages. They may confuse joint, marginal, and conditional frequencies. They may also claim that an apparent association proves one category causes the other.
How to Assess It
- Give students a two-way table showing club membership and grade level. Ask them to calculate two conditional percentages, compare them, and write one supported conclusion.
Lesson moves
Ways to Teach It
Have groups sort survey cards by two categories, build a two-way table, and calculate row percentages.
Ask students to explain whether lunch choice appears related to grade level, citing two values from a provided table.
Play a matching game connecting categorical data tables with the correct bar graphs, percentages, and written conclusions.
Use school attendance data by transportation type to compare absence rates and discuss what conclusions the data supports.
Free download
Printable MA.912.DP.3 Worksheet
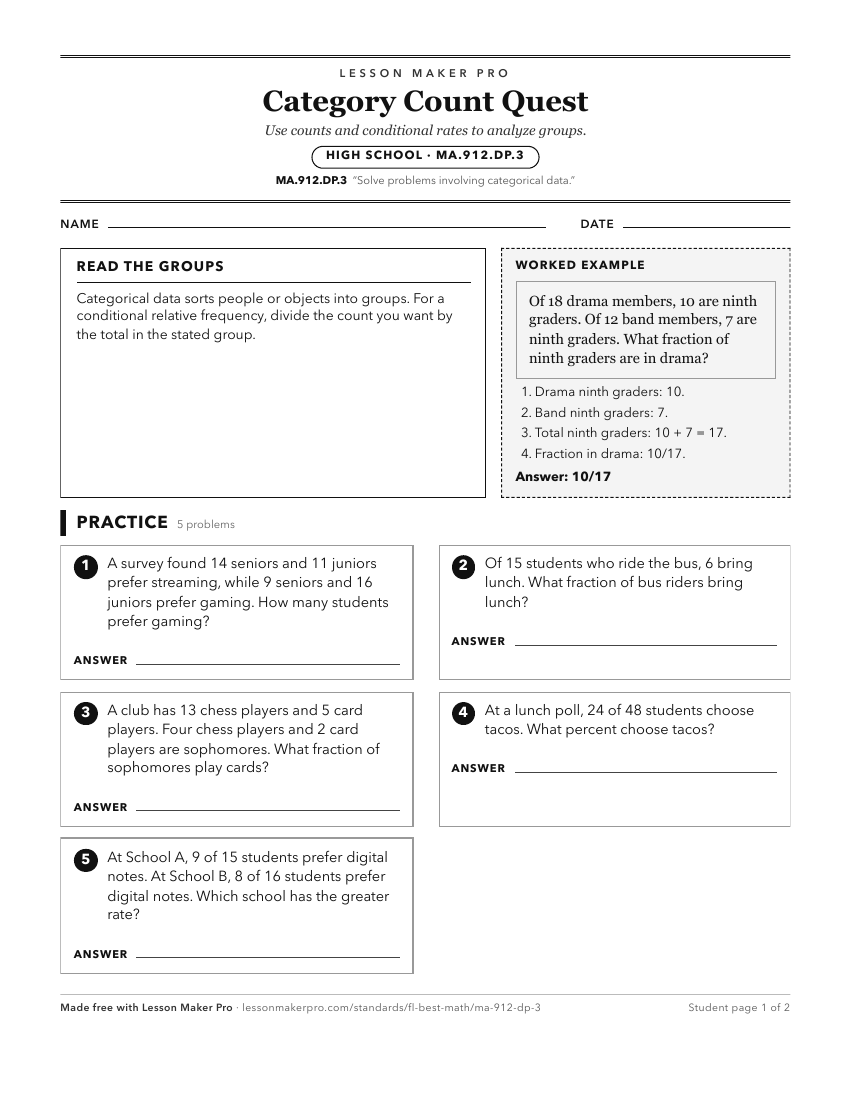
A ready-to-print activity worksheet aligned to MA.912.DP.3, with an answer key for the teacher on its own page. No account needed.
PDF, US Letter, prints cleanly in black and white.
Download the worksheetKeep exploring
Related Standards
Turn this cluster into a lesson
Grade, subject, topic, and the complete cluster are prefilled. Create one free, no account needed.
Also for this cluster:Make a WorksheetMake a QuizMake a Sub Lesson