Florida B.E.S.T. MA.912.DP.3.2
The Standard
Given marginal and conditional relative frequencies, construct a two-way relative frequency table summarizing categorical bivariate data.
Florida B.E.S.T. Standards for Mathematics
Teacher's field guide
What This Standard Means
What Students Need to Do
- Students turn overall group percentages and within-group percentages into the cells of a two-way table. They calculate missing entries and margins while tracking which group each percentage describes.
What Mastery Looks Like
- Students choose the correct group as the denominator for each percentage. They calculate all four joint entries, complete the margins, and check that the full table totals 100%.
Common Misconceptions
- Students may use the whole sample as the denominator when a percentage applies only within one group. They may also reverse conditions or force every row to total 100%.
How to Assess It
- Exit ticket: Of 200 students, 60% play a sport. Of athletes, 40% have jobs, and 25% of nonathletes have jobs. Complete the table, including margins.
Lesson moves
Ways to Teach It
Use 100 counters, place 60 in a sport group, then split both groups by job percentages and record the results.
Ask students to explain why 40% of athletes with jobs differs from 40% of employed students who are athletes.
Give pairs partially completed tables and percentage cards, then have them race to match each card and fill every missing cell.
Use school survey data about transportation and after-school activities to build a table from published subgroup percentages.
Free download
Printable MA.912.DP.3.2 Worksheet
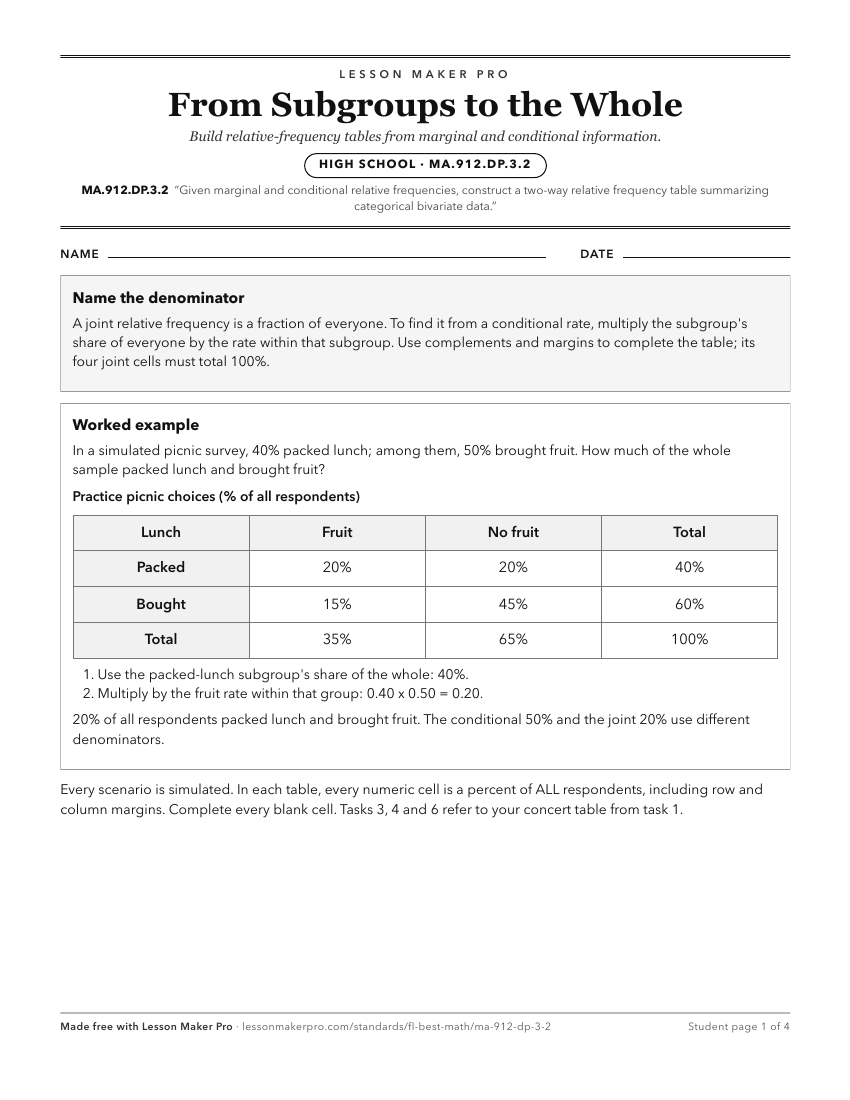
A ready-to-print activity worksheet aligned to MA.912.DP.3.2, with an answer key for the teacher on its own page. No account needed.
PDF, US Letter, prints cleanly in black and white.
Download the worksheetKeep exploring
Related Standards
- MA.912.DP.3.3
Given a two-way relative frequency table or segmented bar graph summarizing categorical bivariate data, interpret joint, marginal and conditional relative frequ...
- MA.912.DP.3.4
Given a relative frequency table, construct and interpret a segmented bar graph.
- MA.912.DP.4.5
Given a two-way table containing data from a population, interpret the joint and marginal relative frequencies as empirical probabilities and the conditional re...
- MA.912.DP.3.1
Construct a two-way frequency table summarizing bivariate categorical data. Interpret joint and marginal frequencies and determine possible associations in term...
Turn this exact standard into a lesson
Grade, subject, topic, and the complete standard are prefilled. Create one free, no account needed.
Also for this standard:Make a WorksheetMake a QuizMake a Sub Lesson