Florida B.E.S.T. MA.912.DP.4.5
The Standard
Given a two-way table containing data from a population, interpret the joint and marginal relative frequencies as empirical probabilities and the conditional relative frequencies as empirical conditional probabilities. Use those probabilities to determine whether characteristics in the population are approximately independent.
Florida B.E.S.T. Standards for Mathematics
Teacher's field guide
What This Standard Means
What Students Need to Do
- Students turn counts in a two-way table into joint, marginal, and conditional probabilities. They compare conditional and overall probabilities to decide whether two characteristics are approximately independent.
What Mastery Looks Like
- A student correctly identifies the needed cells and denominator for each probability. The student compares a conditional probability with the matching overall probability and supports an independence claim with numbers.
Common Misconceptions
- Students may divide by the grand total when a conditional probability needs a row or column total. They may also assume two traits are independent because both appear often, rather than comparing probabilities.
How to Assess It
- Exit ticket: Of 200 students, 120 ride the bus and 72 of those eat breakfast. Of 80 non-riders, 40 eat breakfast. Find P(breakfast), P(breakfast | bus), and decide whether the traits are approximately independent using a 0.05 tolerance.
Lesson moves
Ways to Teach It
Survey the class on two yes-or-no traits, build a sticky-note table, and calculate joint, marginal, and conditional relative frequencies.
Ask students to explain why P(sports | grade 10) uses the grade 10 total rather than the class total.
Run a card sort matching two-way tables, probability statements, numerical values, and justified independence conclusions.
Analyze school attendance and bus-rider data, then decide whether transportation method and absence are approximately independent.
Free download
Printable MA.912.DP.4.5 Worksheet
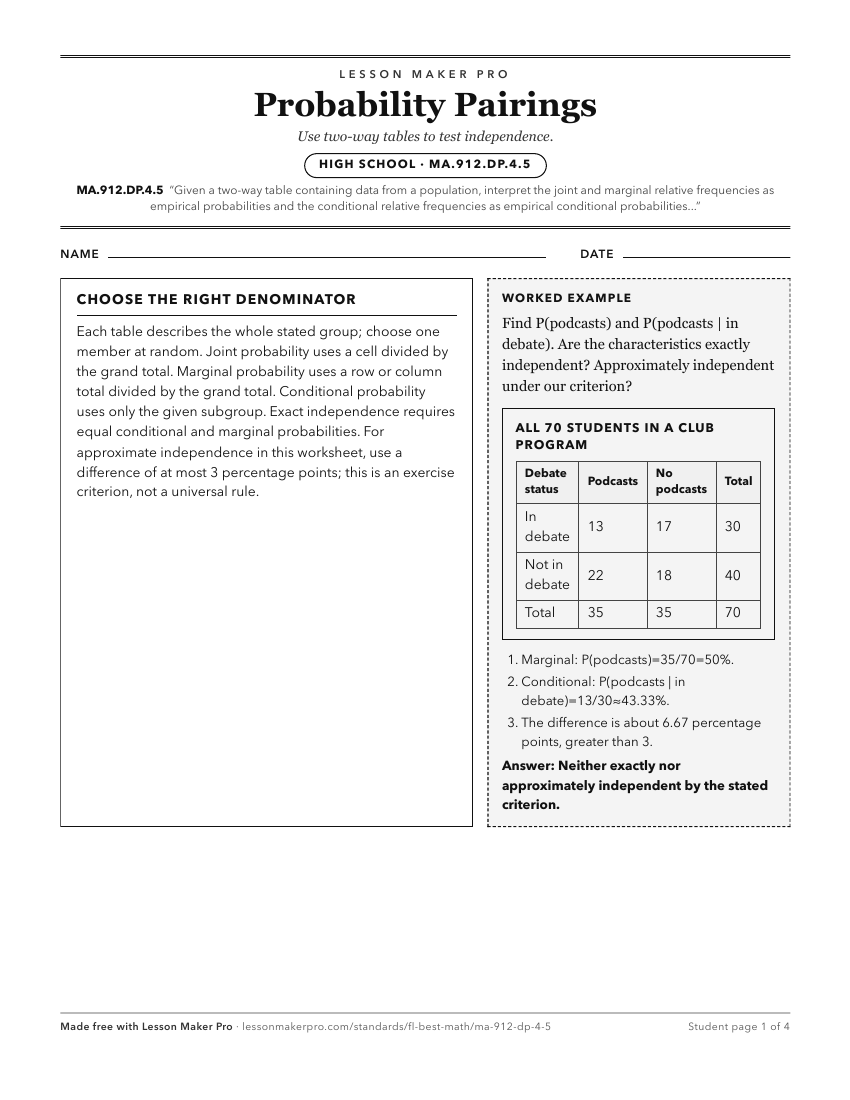
A ready-to-print activity worksheet aligned to MA.912.DP.4.5, with an answer key for the teacher on its own page. No account needed.
PDF, US Letter, prints cleanly in black and white.
Download the worksheetKeep exploring
Related Standards
- MA.912.DP.3.2
Given marginal and conditional relative frequencies, construct a two-way relative frequency table summarizing categorical bivariate data.
- MA.912.DP.3.3
Given a two-way relative frequency table or segmented bar graph summarizing categorical bivariate data, interpret joint, marginal and conditional relative frequ...
- MA.912.DP.4
Use and interpret independence and probability.
- MA.912.DP.3.1
Construct a two-way frequency table summarizing bivariate categorical data. Interpret joint and marginal frequencies and determine possible associations in term...
Turn this exact standard into a lesson
Grade, subject, topic, and the complete standard are prefilled. Create one free, no account needed.
Also for this standard:Make a WorksheetMake a QuizMake a Sub Lesson