Florida B.E.S.T. MA.912.DP.3.3
The Standard
Given a two-way relative frequency table or segmented bar graph summarizing categorical bivariate data, interpret joint, marginal and conditional relative frequencies in terms of a real-world context.
Florida B.E.S.T. Standards for Mathematics
Teacher's field guide
What This Standard Means
What Students Need to Do
- Students locate percentages for two categories together, category totals, and percentages within a selected group. They explain what each percentage means and identify the group used as the denominator.
What Mastery Looks Like
- Students correctly choose the needed row, column, or cell and use the right denominator. They explain each value as a percentage of the relevant group and make supported comparisons.
Common Misconceptions
- Students often divide by the grand total when a conditional frequency requires a row or column total. They may also reverse the condition or confuse “and” with “given.”
How to Assess It
- Exit ticket: For 100 students, bus riders include 0.30 ninth graders and 0.20 tenth graders, while nonriders include 0.10 ninth graders and 0.40 tenth graders. Find and interpret the frequencies for ninth-grade bus riders, all bus riders, and bus riders given ninth grade.
Lesson moves
Ways to Teach It
Give groups 40 survey cards labeled with lunch choice and grade, then have them sort, tabulate, and calculate three frequency types.
Display a segmented bar graph of pet ownership by housing type and ask, “Which group is more likely to own a pet, and why?”
Run a card sort matching probability statements, table entries, calculations, and plain-language interpretations.
Use a school club survey to compare participation rates by grade, then have students recommend where recruitment efforts should focus.
Free download
Printable MA.912.DP.3.3 Worksheet
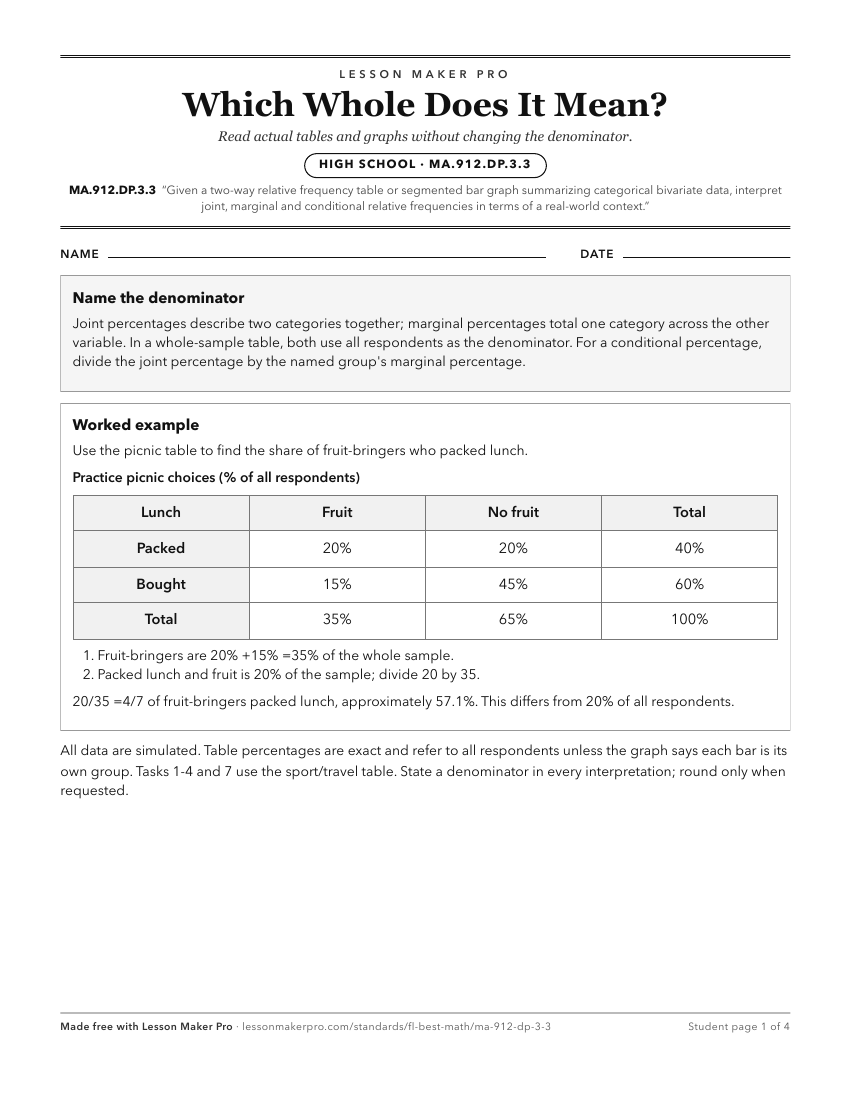
A ready-to-print activity worksheet aligned to MA.912.DP.3.3, with an answer key for the teacher on its own page. No account needed.
PDF, US Letter, prints cleanly in black and white.
Download the worksheetKeep exploring
Related Standards
- MA.912.DP.3.2
Given marginal and conditional relative frequencies, construct a two-way relative frequency table summarizing categorical bivariate data.
- MA.912.DP.3.4
Given a relative frequency table, construct and interpret a segmented bar graph.
- MA.912.DP.4.5
Given a two-way table containing data from a population, interpret the joint and marginal relative frequencies as empirical probabilities and the conditional re...
- MA.912.DP.3.1
Construct a two-way frequency table summarizing bivariate categorical data. Interpret joint and marginal frequencies and determine possible associations in term...
Turn this exact standard into a lesson
Grade, subject, topic, and the complete standard are prefilled. Create one free, no account needed.
Also for this standard:Make a WorksheetMake a QuizMake a Sub Lesson