Florida B.E.S.T. MA.912.DP.3.4
The Standard
Given a relative frequency table, construct and interpret a segmented bar graph.
Florida B.E.S.T. Standards for Mathematics
Teacher's field guide
What This Standard Means
What Students Need to Do
- Students turn relative frequencies into proportional sections of equal-length bars. They label each section and compare how category percentages differ across groups.
What Mastery Looks Like
- Students draw equal-length bars with correctly scaled and labeled segments that total 100%. They compare category shares across groups and support each statement with values from the graph.
Common Misconceptions
- Students may use raw counts as segment lengths instead of relative frequencies. They may make bars different total lengths, forget that each bar represents 100%, or confuse a percentage-point difference with a percent change.
How to Assess It
- Exit ticket: Group A travels by bus 60% and car 40%, while Group B travels by bus 35% and car 65%. Draw two segmented bars and write one accurate comparison.
Lesson moves
Ways to Teach It
Give students 100-square paper strips to shade category percentages from a table, then place the strips side by side for comparison.
Show two segmented bars and ask, "Which category has the largest percentage-point difference, and what values support your answer?"
Play Bar Match with cards showing relative frequency tables, segmented graphs, and written interpretations for students to sort into matching sets.
Survey class lunch choices by grade, calculate percentages, and create segmented bars to compare the distributions.
Free download
Printable MA.912.DP.3.4 Worksheet
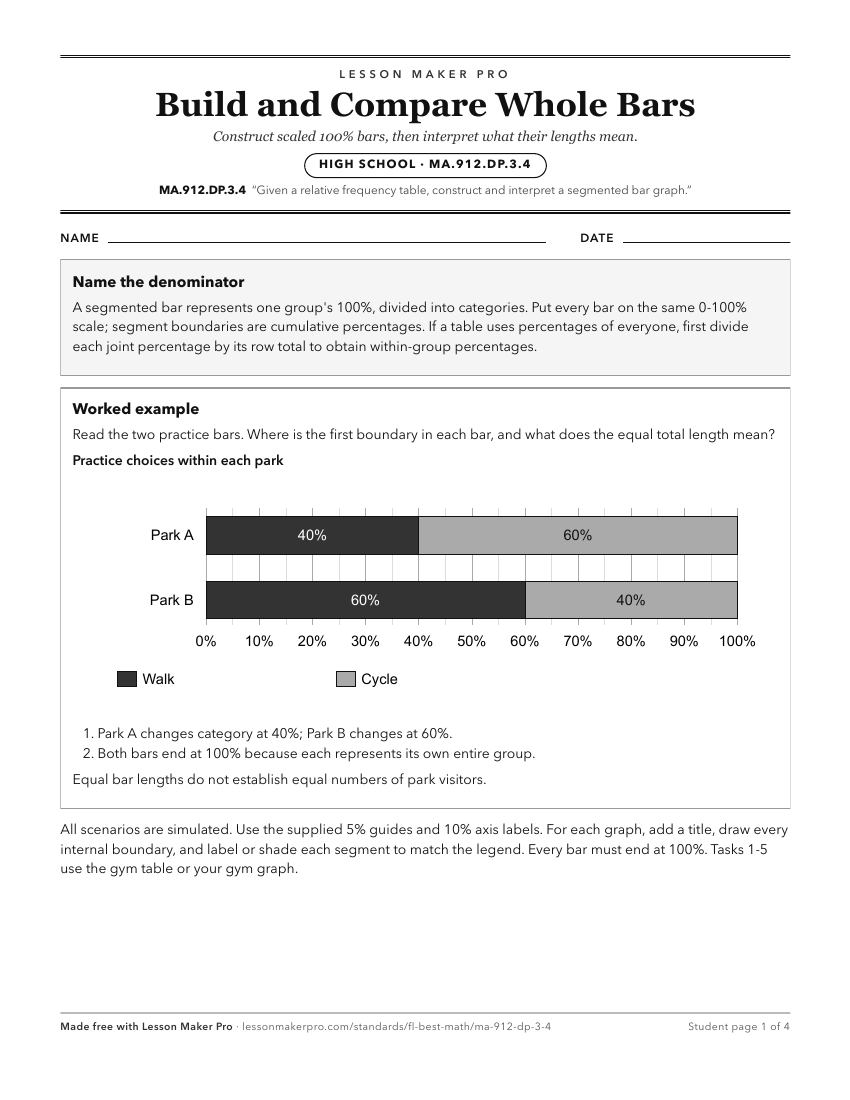
A ready-to-print activity worksheet aligned to MA.912.DP.3.4, with an answer key for the teacher on its own page. No account needed.
PDF, US Letter, prints cleanly in black and white.
Download the worksheetKeep exploring
Related Standards
- MA.912.DP.3.2
Given marginal and conditional relative frequencies, construct a two-way relative frequency table summarizing categorical bivariate data.
- MA.912.DP.3.3
Given a two-way relative frequency table or segmented bar graph summarizing categorical bivariate data, interpret joint, marginal and conditional relative frequ...
- MA.7.DP.1.4
Use proportional reasoning to construct, display and interpret data in circle graphs.
- MA.912.DP.3.1
Construct a two-way frequency table summarizing bivariate categorical data. Interpret joint and marginal frequencies and determine possible associations in term...
Turn this exact standard into a lesson
Grade, subject, topic, and the complete standard are prefilled. Create one free, no account needed.
Also for this standard:Make a WorksheetMake a QuizMake a Sub Lesson