Florida B.E.S.T. MA.912.DP.1.5
The Standard
Interpret the margin of error of a mean or percentage from a data set. Interpret the confidence level corresponding to the margin of error.
Florida B.E.S.T. Standards for Mathematics
Teacher's field guide
What This Standard Means
What Students Need to Do
- Students use an estimate and its margin of error to state a plausible interval for a population mean or percentage. They explain confidence level as the long-run success rate of intervals made by the same sampling method.
What Mastery Looks Like
- A student reads 42% with a 3-point margin of error as a plausible range from 39% to 45%. The student explains that a 95% method would capture the actual population percentage in about 95% of repeated samples.
Common Misconceptions
- Students often treat the margin of error as the full width of the interval instead of the distance from the estimate. They may think 95% confidence means 95% of the data fall inside the interval. They may also apply the interval to individuals rather than the population mean or percentage.
How to Assess It
- Exit ticket: A poll reports 54% support with a 4-point margin of error at 95% confidence. Ask students to write the interval and explain what 95% confidence means for the polling method.
Lesson moves
Ways to Teach It
Draw repeated samples of 20 colored counters, use a provided margin of error table, and mark which intervals contain the known bag percentage.
Discuss the claim, “A 95% confidence level means 95% of surveyed people gave answers inside the interval,” then correct it.
Match cards showing an estimate, margin of error, interval, and confidence statement; discard any set with a misleading interpretation.
Use two published poll summaries to write plausible percentage ranges and explain what each confidence level says about the polling method.
Free download
Printable MA.912.DP.1.5 Worksheet
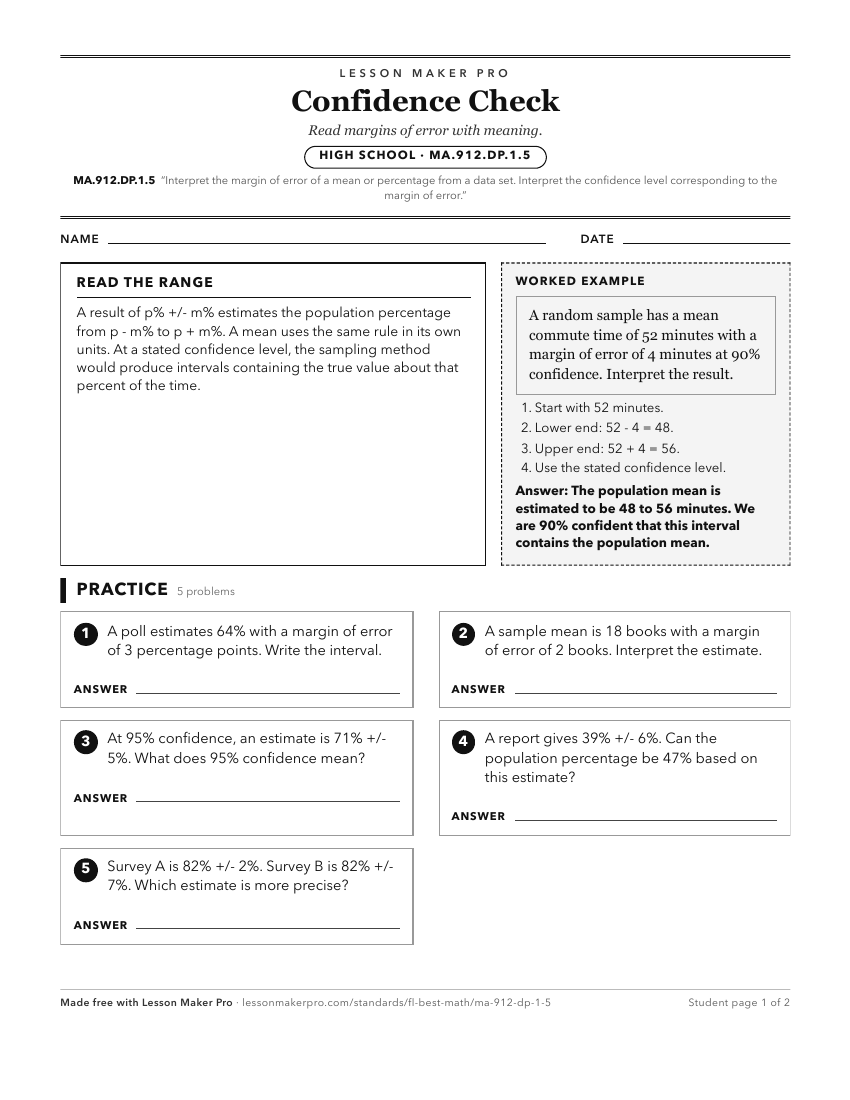
A ready-to-print activity worksheet aligned to MA.912.DP.1.5, with an answer key for the teacher on its own page. No account needed.
PDF, US Letter, prints cleanly in black and white.
Download the worksheetKeep exploring
Related Standards
- MA.912.DP.1.4
Estimate a population total, mean or percentage using data from a sample survey; develop a margin of error through the use of simulation.
- MA.5.DP.1.2
Interpret numerical data, with whole-number values, represented with tables or line plots by determining the mean, mode, median or range.
- MA.912.DP.2.2
Use the mean and standard deviation of a data set to fit it to a normal distribution and to estimate population percentages. Recognize that there are data sets ...
- MA.6.DP.1.2
Given a numerical data set within a real-world context, find and interpret mean, median, mode and range.
Turn this exact standard into a lesson
Grade, subject, topic, and the complete standard are prefilled. Create one free, no account needed.
Also for this standard:Make a WorksheetMake a QuizMake a Sub Lesson