Florida B.E.S.T. MA.912.DP.2.2
The Standard
Use the mean and standard deviation of a data set to fit it to a normal distribution and to estimate population percentages. Recognize that there are data sets for which such a procedure is not appropriate.
Florida B.E.S.T. Standards for Mathematics
Teacher's field guide
What This Standard Means
What Students Need to Do
- Students use a data set’s mean and standard deviation to model its distribution with a normal curve. They estimate percentages in specified intervals and decide whether the data’s shape makes that model reasonable.
What Mastery Looks Like
- Students calculate or use the mean and standard deviation to mark intervals on a normal curve. They estimate population percentages within given ranges and reject a normal model when the data are skewed, multimodal, or strongly affected by outliers.
Common Misconceptions
- Students may assume every bell-shaped graph is normal or that every data set can use a normal model. They may confuse standard deviation with the full range or count observations instead of estimating percentages. Skew, gaps, multiple peaks, and strong outliers are often overlooked.
How to Assess It
- Give students a histogram with mean 70 and standard deviation 5. Ask them to estimate the percent from 65 to 80 and explain whether a normal model is reasonable.
Lesson moves
Ways to Teach It
Measure class hand spans, make a histogram, calculate the mean and standard deviation, then estimate the percentage within one standard deviation.
Show one symmetric histogram and one skewed histogram, then ask students to defend which can reasonably use a normal model.
Run a card sort matching value ranges, standard deviation intervals, and estimated percentages under the empirical rule.
Use package weight data to estimate the percentage below a company limit and discuss when a normal model supports quality control.
Free download
Printable MA.912.DP.2.2 Worksheet
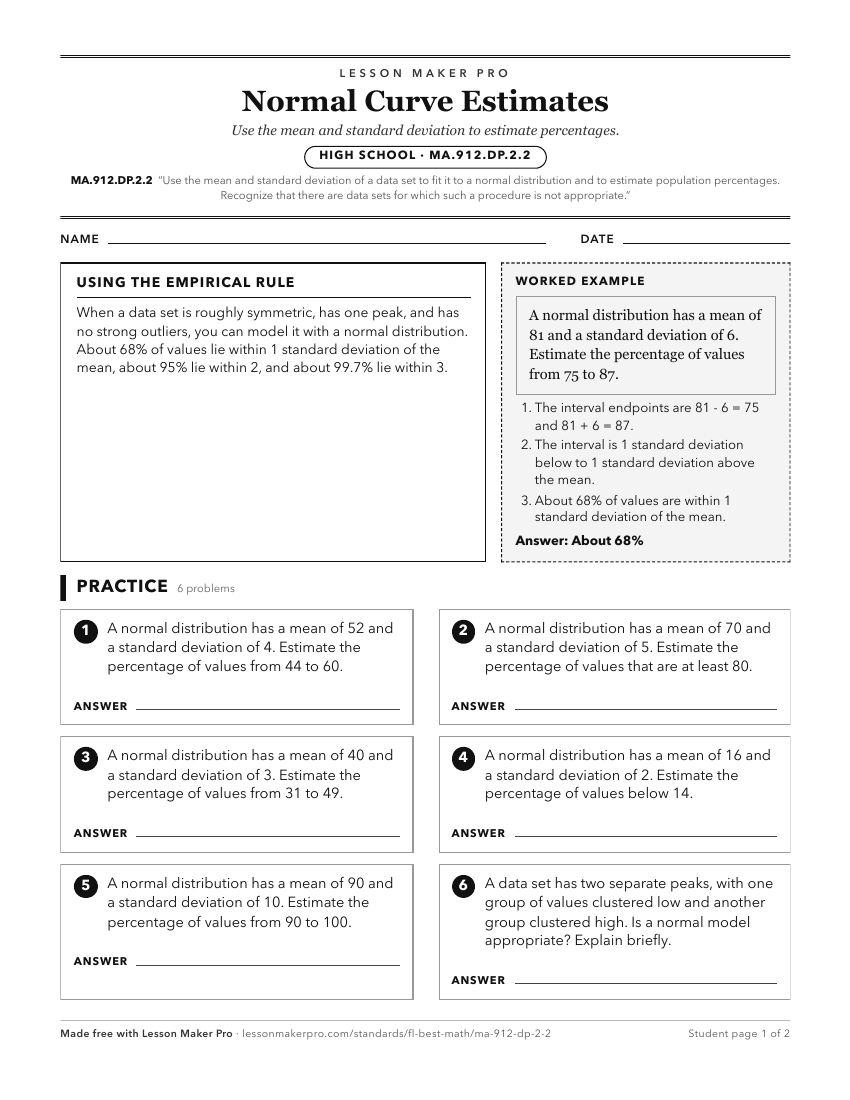
A ready-to-print activity worksheet aligned to MA.912.DP.2.2, with an answer key for the teacher on its own page. No account needed.
PDF, US Letter, prints cleanly in black and white.
Download the worksheetKeep exploring
Related Standards
- MA.912.DP.1.4
Estimate a population total, mean or percentage using data from a sample survey; develop a margin of error through the use of simulation.
- MA.912.DP.2.3
Estimate population percentages from data that has been fit to the normal distribution.
- MA.7.DP.1.2
Given two numerical or graphical representations of data, use the measure(s) of center and measure(s) of variability to make comparisons, interpret results and ...
- MA.6.DP.1.2
Given a numerical data set within a real-world context, find and interpret mean, median, mode and range.
Turn this exact standard into a lesson
Grade, subject, topic, and the complete standard are prefilled. Create one free, no account needed.
Also for this standard:Make a WorksheetMake a QuizMake a Sub Lesson