Florida B.E.S.T. MA.7.DP.1.2
The Standard
Given two numerical or graphical representations of data, use the measure(s) of center and measure(s) of variability to make comparisons, interpret results and draw conclusions about the two populations.
Florida B.E.S.T. Standards for Mathematics
Teacher's field guide
What This Standard Means
What Students Need to Do
- Students compare two data sets using measures of center and variability. They explain what the differences show and draw a supported conclusion about the populations.
What Mastery Looks Like
- Students correctly calculate or read measures of center and variability from lists, tables, or graphs. They use both measures to make a clear comparison and support a conclusion in context.
Common Misconceptions
- Students may assume a higher mean means every value is higher. They may compare centers but ignore spread, or confuse range with a typical value. Different graph scales can also lead to faulty comparisons.
How to Assess It
- Give delay times for Route A: 4, 5, 5, 6, 10 and Route B: 5, 6, 6, 7, 8. Ask students to compare typical delay and consistency using median and range.
Lesson moves
Ways to Teach It
Have groups build two dot plots with sticky notes, then compare the medians and ranges of the displayed data.
Ask students: Can two groups have the same median but differ greatly in spread? Explain with an example.
Use a card sort matching data sets, graphs, summary measures, and valid comparison statements.
Compare weekly temperatures from two cities, then decide which city was warmer and which had more consistent weather.
Free download
Printable MA.7.DP.1.2 Worksheet
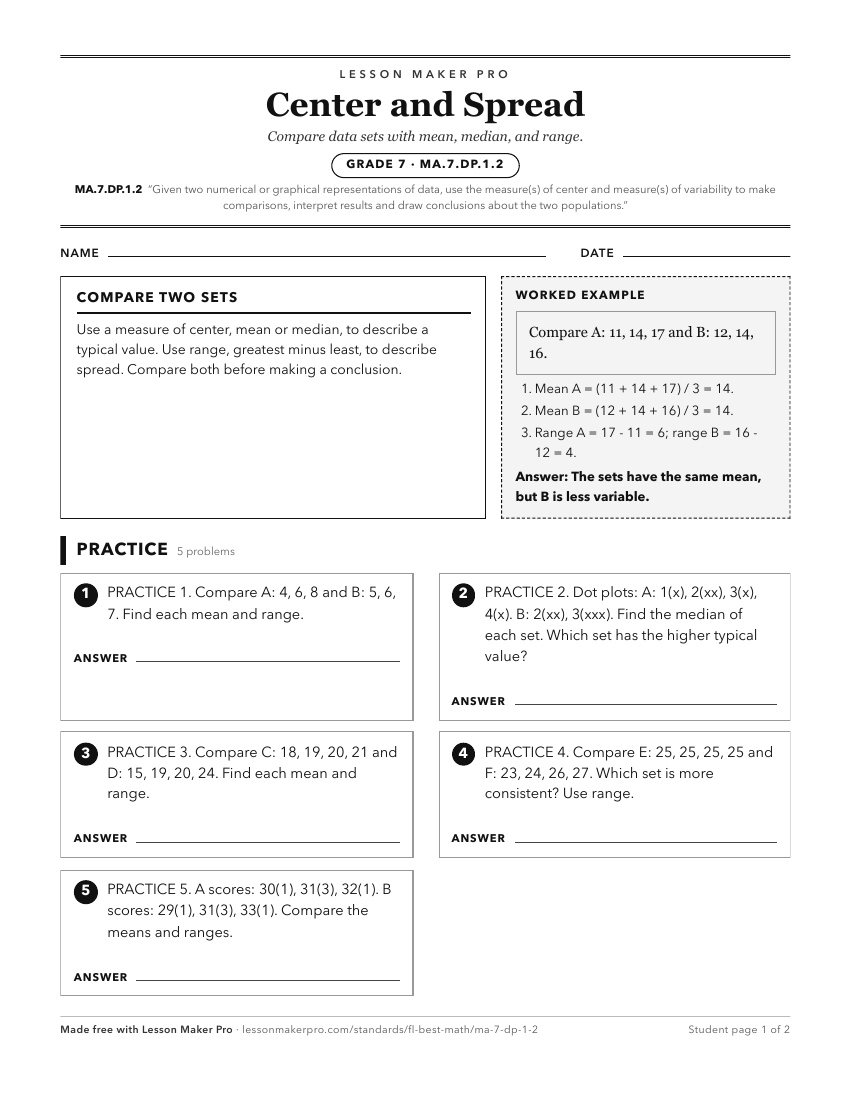
A ready-to-print activity worksheet aligned to MA.7.DP.1.2, with an answer key for the teacher on its own page. No account needed.
PDF, US Letter, prints cleanly in black and white.
Download the worksheetKeep exploring
Related Standards
- MA.6.DP.1.6
Given a real-world scenario, determine and describe how changes in data values impact measures of center and variation.
- MA.912.DP.2.1
For two or more sets of numerical univariate data, calculate and compare the appropriate measures of center and measures of variability, accounting for possible...
- MA.6.DP.1
Develop an understanding of statistics and determine measures of center and measures of variability. Summarize statistical distributions graphically and numeric...
- MA.7.DP.1.1
Determine an appropriate measure of center or measure of variation to summarize numerical data, represented numerically or graphically, taking into consideratio...
Turn this exact standard into a lesson
Grade, subject, topic, and the complete standard are prefilled. Create one free, no account needed.
Also for this standard:Make a WorksheetMake a QuizMake a Sub Lesson