Florida B.E.S.T. MA.6.DP.1.6
The Standard
Given a real-world scenario, determine and describe how changes in data values impact measures of center and variation.
Florida B.E.S.T. Standards for Mathematics
Teacher's field guide
What This Standard Means
What Students Need to Do
- Students calculate measures of center and variation before and after one or more data values change. They describe how the change affects the mean, median, mode, and range.
What Mastery Looks Like
- Students correctly calculate each measure before and after a data value changes. They explain which measures changed, which stayed the same, and why.
Common Misconceptions
- Students may assume every data change affects all measures. They may also confuse range with the greatest value or expect an outlier to change the median greatly.
How to Assess It
- Use this exit ticket: Café sales were 12, 14, 14, 15, and 20; replace 20 with 30, then compare each measure.
Lesson moves
Ways to Teach It
Give groups number cards, then replace one card and have them recalculate the mean, median, mode, and range.
Ask students to explain why changing the greatest value often affects the mean and range more than the median.
Play Change One Number, where partners alter a data set to change exactly two measures while keeping the others unchanged.
Compare team scoring averages before and after one unusually high score, then discuss how that score affects the reported results.
Free download
Printable MA.6.DP.1.6 Worksheet
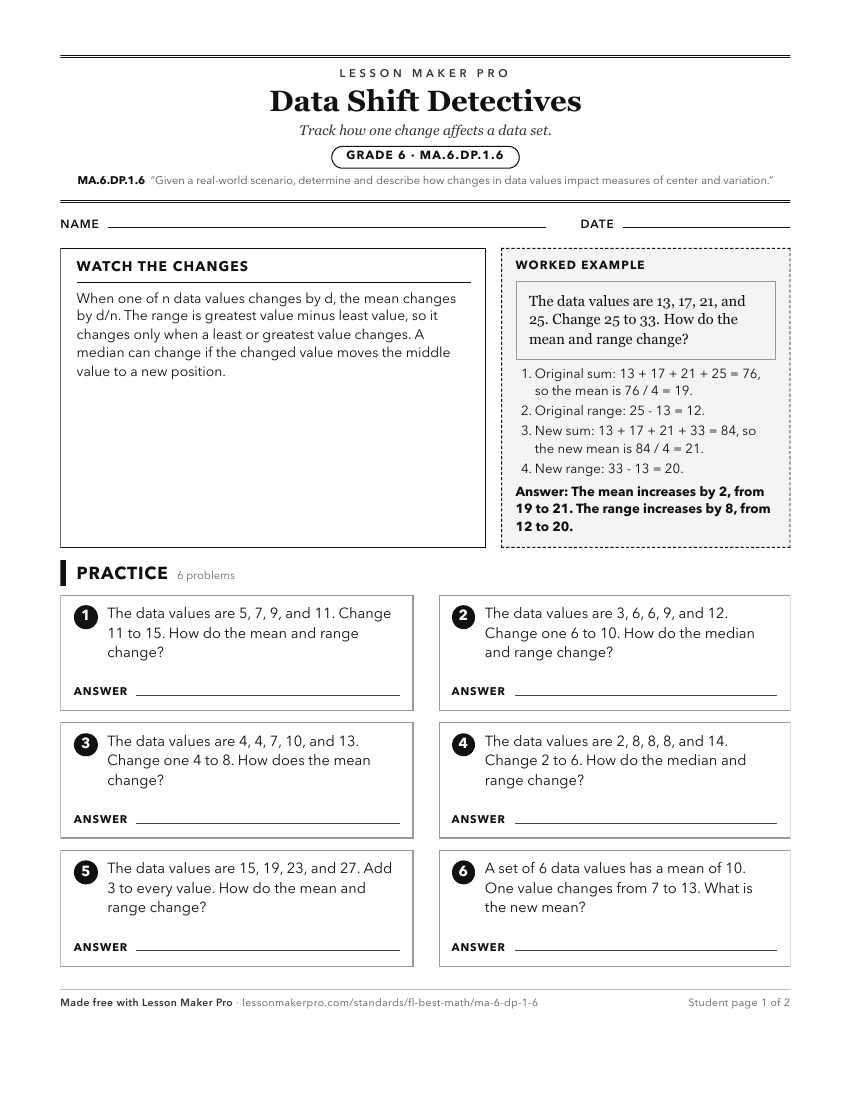
A ready-to-print activity worksheet aligned to MA.6.DP.1.6, with an answer key for the teacher on its own page. No account needed.
PDF, US Letter, prints cleanly in black and white.
Download the worksheetKeep exploring
Related Standards
- MA.912.DP.2.1
For two or more sets of numerical univariate data, calculate and compare the appropriate measures of center and measures of variability, accounting for possible...
- MA.7.DP.1.2
Given two numerical or graphical representations of data, use the measure(s) of center and measure(s) of variability to make comparisons, interpret results and ...
- MA.6.DP.1.2
Given a numerical data set within a real-world context, find and interpret mean, median, mode and range.
- MA.7.DP.1.1
Determine an appropriate measure of center or measure of variation to summarize numerical data, represented numerically or graphically, taking into consideratio...
Turn this exact standard into a lesson
Grade, subject, topic, and the complete standard are prefilled. Create one free, no account needed.
Also for this standard:Make a WorksheetMake a QuizMake a Sub Lesson