Florida B.E.S.T. MA.7.DP.1.1
The Standard
Determine an appropriate measure of center or measure of variation to summarize numerical data, represented numerically or graphically, taking into consideration the context and any outliers.
Florida B.E.S.T. Standards for Mathematics
Teacher's field guide
What This Standard Means
What Students Need to Do
- Students inspect a data set or graph and decide which measure best describes its center or spread. They use context, shape, and outliers to justify the choice.
What Mastery Looks Like
- A student chooses the median and interquartile range when an outlier would distort the mean or inflate the range. For balanced data without outliers, the student can defend using the mean and range.
Common Misconceptions
- Students often choose the mean automatically, even when one extreme value pulls it away from most data. They may call the largest value the range or use range to describe center. Some assume an outlier changes the median as much as it changes the mean.
How to Assess It
- Exit ticket: The weekly exercise hours are 2, 3, 3, 4, 4, and 18. Choose mean or median and range or interquartile range, then justify each choice in one sentence.
Lesson moves
Ways to Teach It
Place six value cards on a floor number line, then mark the mean, median, range, and interquartile range before and after adding an outlier.
Ask: Which better describes home prices on a street with one mansion, mean or median, and why?
Play Summary Sort: teams match data cards to mean, median, range, or interquartile range cards, then earn points for a context-based defense.
Use local weather temperatures and one recording error to decide which center and spread should appear in a school weather report.
Free download
Printable MA.7.DP.1.1 Worksheet
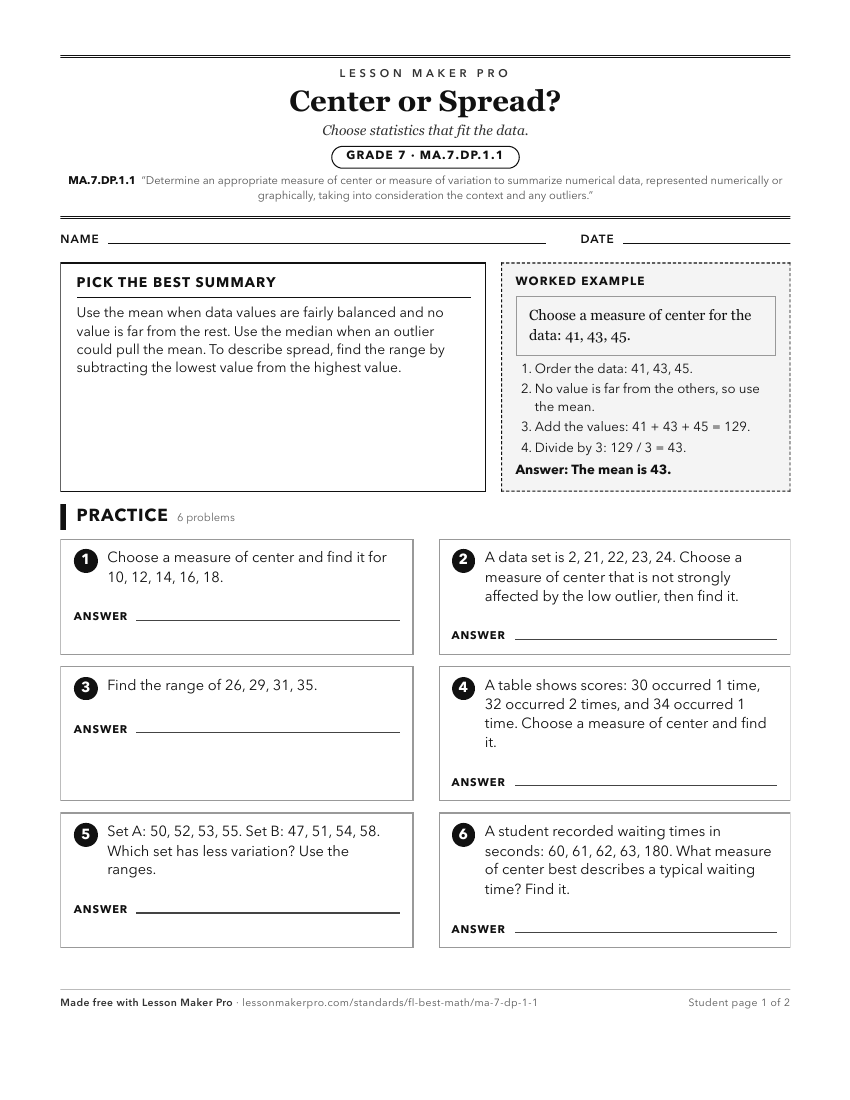
A ready-to-print activity worksheet aligned to MA.7.DP.1.1, with an answer key for the teacher on its own page. No account needed.
PDF, US Letter, prints cleanly in black and white.
Download the worksheetKeep exploring
Related Standards
- MA.6.DP.1.6
Given a real-world scenario, determine and describe how changes in data values impact measures of center and variation.
- MA.912.DP.2.1
For two or more sets of numerical univariate data, calculate and compare the appropriate measures of center and measures of variability, accounting for possible...
- MA.6.DP.1
Develop an understanding of statistics and determine measures of center and measures of variability. Summarize statistical distributions graphically and numeric...
- MA.7.DP.1.2
Given two numerical or graphical representations of data, use the measure(s) of center and measure(s) of variability to make comparisons, interpret results and ...
Turn this exact standard into a lesson
Grade, subject, topic, and the complete standard are prefilled. Create one free, no account needed.
Also for this standard:Make a WorksheetMake a QuizMake a Sub Lesson