Florida B.E.S.T. MA.912.DP.2.3
The Standard
Estimate population percentages from data that has been fit to the normal distribution.
Florida B.E.S.T. Standards for Mathematics
Teacher's field guide
What This Standard Means
What Students Need to Do
- Students use a normal model, its mean, and its standard deviation to estimate the share of a population within given bounds. They convert bounds to z-scores and use a table, calculator, or normal curve.
What Mastery Looks Like
- Given a mean, standard deviation, and interval, a student calculates appropriate z-scores and finds the corresponding area. The student reports the result as a population percentage in context.
Common Misconceptions
- Students may treat a z-score as a percentage or use variance instead of standard deviation. They may also forget to subtract cumulative areas when finding the percentage between two values.
How to Assess It
- Give this exit ticket: “Scores are normally distributed with mean 72 and standard deviation 6. Estimate the percentage between 66 and 81. Show your method.”
Lesson moves
Ways to Teach It
Have students place labeled value cards along a floor number line, then count cards within selected normal-curve intervals.
Ask students to explain why the percentage within one standard deviation stays the same when the mean changes.
Play a matching game with cards showing intervals, z-scores, normal-curve regions, and estimated percentages.
Use normally modeled package weights to estimate the percentage that falls below the company’s minimum acceptable weight.
Free download
Printable MA.912.DP.2.3 Worksheet
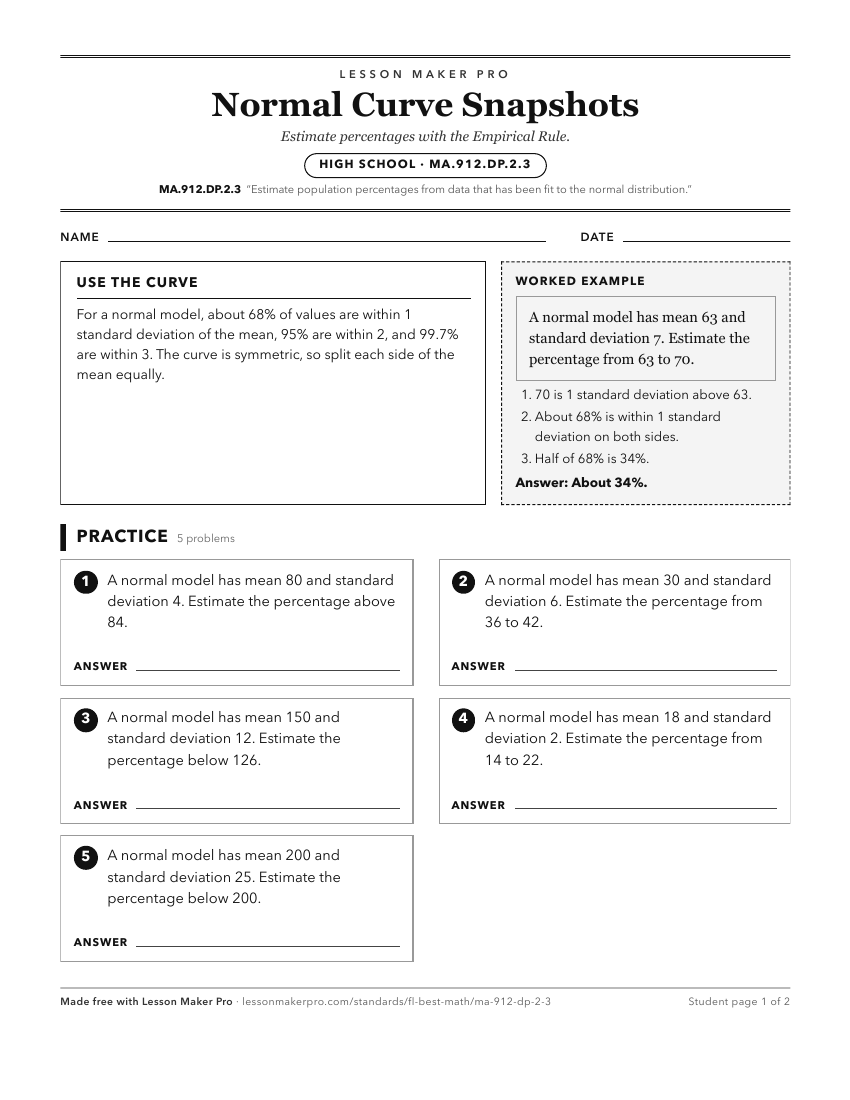
A ready-to-print activity worksheet aligned to MA.912.DP.2.3, with an answer key for the teacher on its own page. No account needed.
PDF, US Letter, prints cleanly in black and white.
Download the worksheetKeep exploring
Related Standards
- MA.7.DP.1.3
Given categorical data from a random sample, use proportional relationships to make predictions about a population.
- MA.912.DP.6
Use probability distributions to solve problems.
- MA.912.DP.1.4
Estimate a population total, mean or percentage using data from a sample survey; develop a margin of error through the use of simulation.
- MA.912.DP.2.2
Use the mean and standard deviation of a data set to fit it to a normal distribution and to estimate population percentages. Recognize that there are data sets ...
Turn this exact standard into a lesson
Grade, subject, topic, and the complete standard are prefilled. Create one free, no account needed.
Also for this standard:Make a WorksheetMake a QuizMake a Sub Lesson