Florida B.E.S.T. MA.7.DP.1.3
The Standard
Given categorical data from a random sample, use proportional relationships to make predictions about a population.
Florida B.E.S.T. Standards for Mathematics
Teacher's field guide
What This Standard Means
What Students Need to Do
- Students turn category counts from a random sample into fractions, decimals, or percents. They use those proportions to estimate how many people in the full group fit each category.
What Mastery Looks Like
- Students calculate a category’s fraction or percent in a random sample. They multiply that proportion by the population size and report a reasonable whole-number estimate. They explain that the result is a prediction, not an exact count.
Common Misconceptions
- Students may multiply the sample count by the population size instead of using a fraction or percent. They may use the wrong sample size as the denominator. They may treat a prediction as exact or trust a convenience sample.
How to Assess It
- Exit ticket: In a random sample of 80 students, 30 choose soccer; estimate how many of 640 students would choose soccer and show your calculation.
Lesson moves
Ways to Teach It
Draw 15 counters randomly from a covered bag, calculate the red proportion, predict reds in the bag, then reveal and count.
Write which survey better predicts schoolwide club interest: 40 randomly selected students or 40 drama club members, and explain why.
Run a card-match race pairing sample results and population sizes with the correct predicted category totals.
Use a random lunch survey to predict how many meals of each type the cafeteria should prepare.
Free download
Printable MA.7.DP.1.3 Worksheet
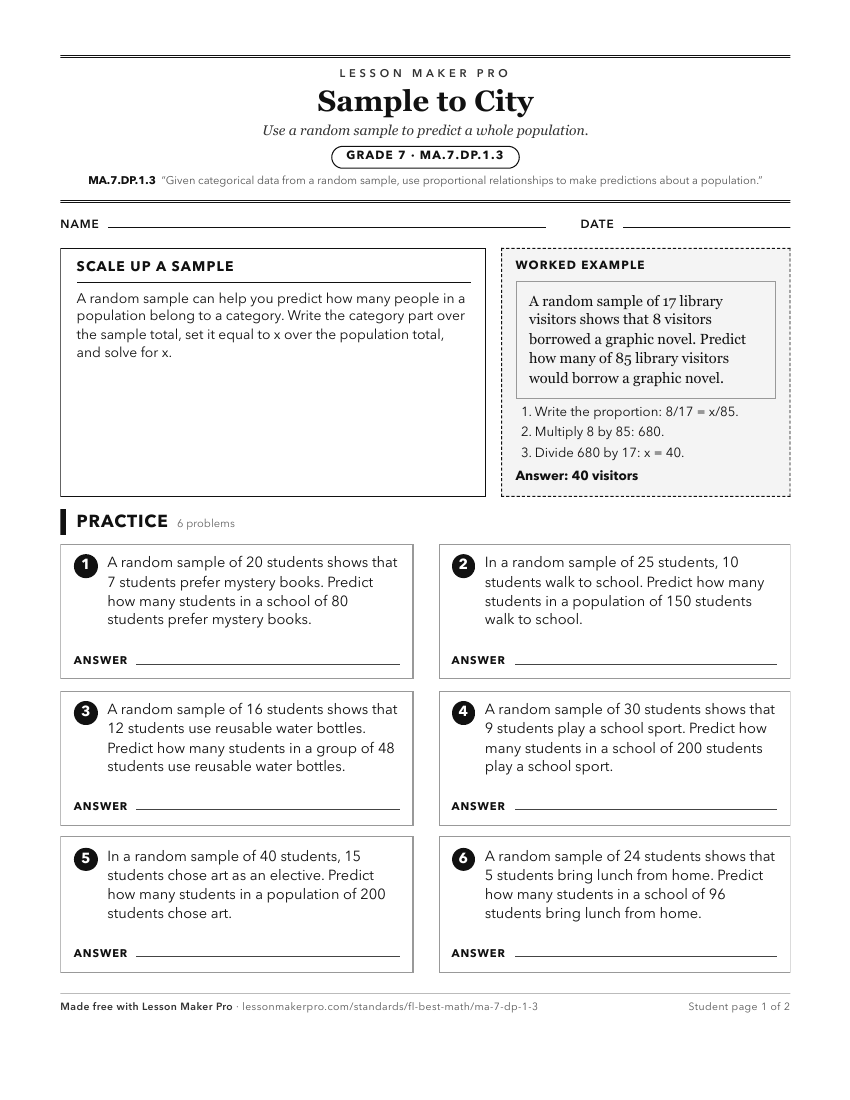
A ready-to-print activity worksheet aligned to MA.7.DP.1.3, with an answer key for the teacher on its own page. No account needed.
PDF, US Letter, prints cleanly in black and white.
Download the worksheetKeep exploring
Related Standards
- MA.912.DP.5.8
Draw inferences about two populations using data and statistical analysis from two random samples.
- MA.912.DP.2.3
Estimate population percentages from data that has been fit to the normal distribution.
- MA.912.DP.3
Solve problems involving categorical data.
- MA.8.AR.3.1
Determine if a linear relationship is also a proportional relationship.
Turn this exact standard into a lesson
Grade, subject, topic, and the complete standard are prefilled. Create one free, no account needed.
Also for this standard:Make a WorksheetMake a QuizMake a Sub Lesson