Florida B.E.S.T. MA.912.DP.5.8
The Standard
Draw inferences about two populations using data and statistical analysis from two random samples.
Florida B.E.S.T. Standards for Mathematics
Teacher's field guide
What This Standard Means
What Students Need to Do
- Students compare random samples from two groups using graphs and statistics such as means, medians, proportions, and measures of spread. They decide whether a sample difference likely reflects a population difference or ordinary sampling variation.
What Mastery Looks Like
- Students correctly compare centers, spreads, and overlap in two sample distributions. They explain whether the observed difference is large relative to sampling variability. Their conclusion names the populations and includes an appropriate limitation.
Common Misconceptions
- Students may treat any difference between sample statistics as proof that the populations differ. They may ignore sample size, spread, overlap, or biased sampling. Some also claim that an observed association proves causation.
How to Assess It
- Give this exit ticket: School A has a sample mean commute of 24 minutes with MAD 5, while School B has 18 minutes with MAD 4. Ask students to make an inference, support it with the statistics, and name one limitation.
Lesson moves
Ways to Teach It
Fill two bags with different mixes of colored cubes, draw random samples, compare proportions, then repeat to track sampling variation.
Show two overlapping dot plots and ask, “What claim about the populations is supported, and what evidence makes the claim reasonable?”
Play Sample Showdown, where teams compare paired sample cards and earn points for justified population claims using center, spread, and overlap.
Collect random wait times from two local businesses, compare the samples, and write a recommendation that includes evidence and a limitation.
Free download
Printable MA.912.DP.5.8 Worksheet
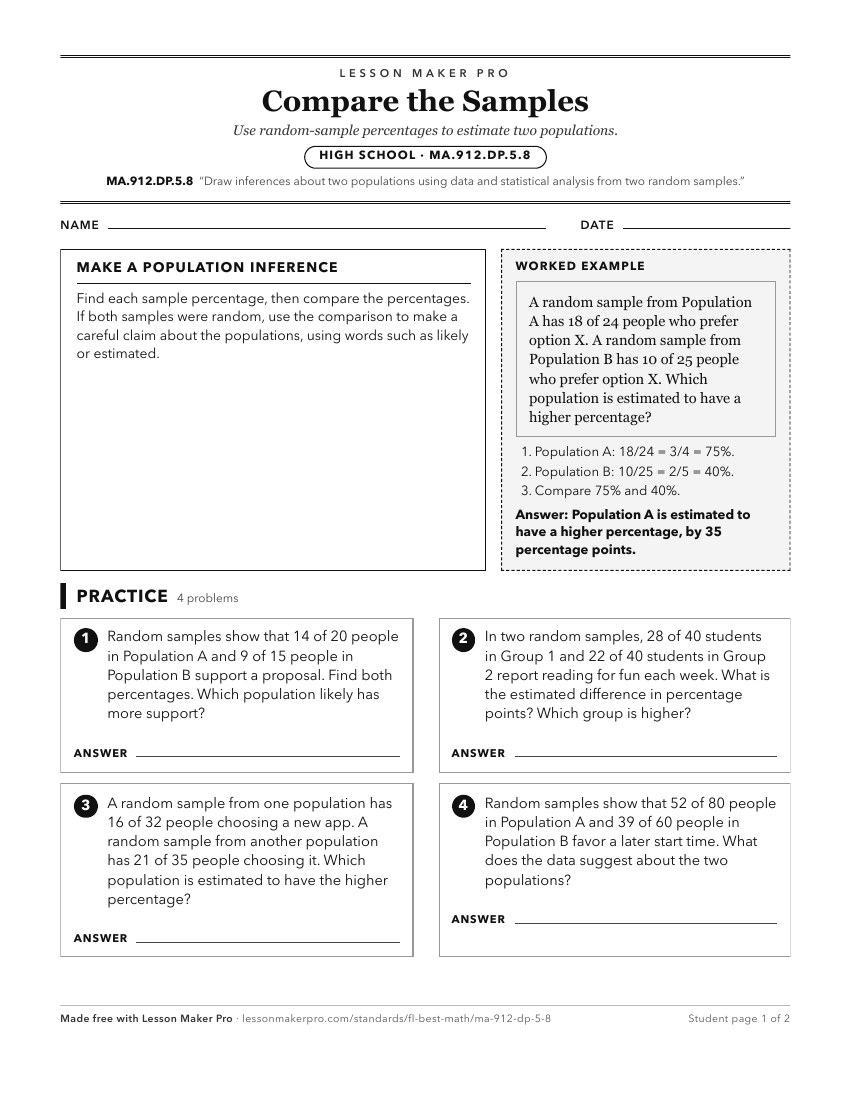
A ready-to-print activity worksheet aligned to MA.912.DP.5.8, with an answer key for the teacher on its own page. No account needed.
PDF, US Letter, prints cleanly in black and white.
Download the worksheetKeep exploring
Related Standards
- MA.7.DP.1.3
Given categorical data from a random sample, use proportional relationships to make predictions about a population.
- MA.912.DP.5
Determine methods of data collection and make inferences from collected data.
- MA.7.DP.1.2
Given two numerical or graphical representations of data, use the measure(s) of center and measure(s) of variability to make comparisons, interpret results and ...
- MA.912.DP.5.9
Compare two treatments using data from an experiment in which the treatments are assigned randomly.
Turn this exact standard into a lesson
Grade, subject, topic, and the complete standard are prefilled. Create one free, no account needed.
Also for this standard:Make a WorksheetMake a QuizMake a Sub Lesson