Florida B.E.S.T. MA.912.DP.5
B.E.S.T. Standard (Benchmark Cluster)
Determine methods of data collection and make inferences from collected data.
Florida B.E.S.T. Standards for Mathematics
Cluster contents
Benchmarks in This Standard
MA.912.DP.5 is a B.E.S.T. standard. These are the benchmarks under it.
- MA.912.DP.5.1
Distinguish between a population parameter and a sample statistic.
- MA.912.DP.5.10
Determine whether differences between parameters are significant using simulations.
- MA.912.DP.5.11
Evaluate reports based on data from diverse media, print and digital resources by interpreting graphs and tables; evaluating data-based arguments; determining w...
- MA.912.DP.5.2
Explain how random sampling produces data that is representative of a population.
- MA.912.DP.5.3
Compare and contrast sampling methods.
- MA.912.DP.5.4
Generate multiple samples or simulated samples of the same size to measure the variation in estimates or predictions.
- MA.912.DP.5.5
Determine if a specific model is consistent within a given process by analyzing the data distribution from a data-generating process.
- MA.912.DP.5.6
Determine the appropriate design, survey, experiment or observational study, based on the purpose. Articulate the types of questions appropriate for each type o...
- MA.912.DP.5.7
Compare and contrast surveys, experiments and observational studies.
- MA.912.DP.5.8
Draw inferences about two populations using data and statistical analysis from two random samples.
- MA.912.DP.5.9
Compare two treatments using data from an experiment in which the treatments are assigned randomly.
Teacher's field guide
What This Cluster Means
What Students Need to Do
- Students match a data collection method to a question and explain how sampling choices affect results. They use the collected data to make reasonable claims without overstating what the evidence shows.
What Mastery Looks Like
- Students choose a survey, observational study, or experiment that fits the question. They select a fair sample, identify possible bias, and make conclusions that match the collection method and evidence.
Common Misconceptions
- Students may treat a convenience sample as representative or assume a large sample removes all bias. They may also claim cause and effect from a survey or observational study.
How to Assess It
- Give students a school lunch survey that sampled only student athletes. Ask them to identify the flaw, propose a better sample, and state one justified inference.
Lesson moves
Ways to Teach It
Place colored cubes in a hidden bag, let groups choose a sampling method, collect samples, and estimate the bag's color distribution.
Ask students to explain whether surveying the first 30 students entering school can represent the whole student body.
Give teams scenario cards to sort into survey, observational study, or experiment, then award points for identifying bias and valid conclusions.
Use local weather records to choose a sampling period and decide what claims the sample supports about typical monthly temperatures.
Free download
Printable MA.912.DP.5 Worksheet
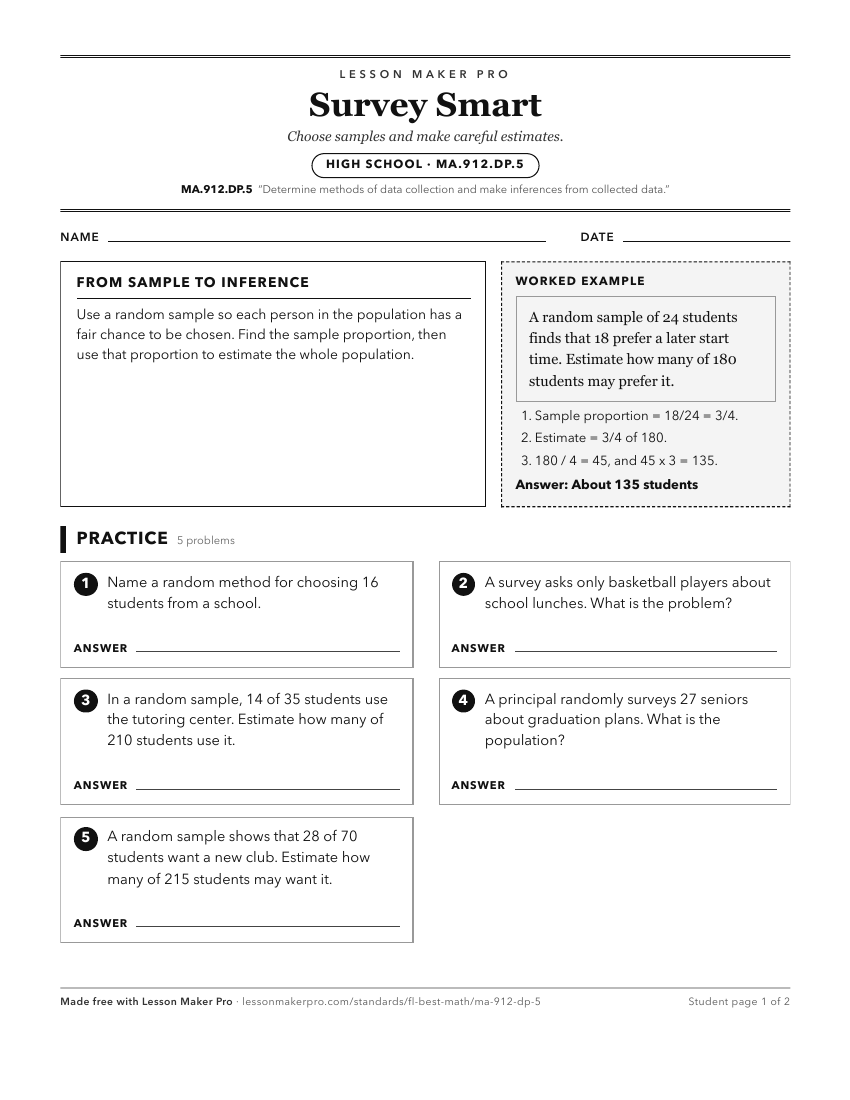
A ready-to-print activity worksheet aligned to MA.912.DP.5, with an answer key for the teacher on its own page. No account needed.
PDF, US Letter, prints cleanly in black and white.
Download the worksheetKeep exploring
Related Standards
Turn this cluster into a lesson
Grade, subject, topic, and the complete cluster are prefilled. Create one free, no account needed.
Also for this cluster:Make a WorksheetMake a QuizMake a Sub Lesson