Florida B.E.S.T. MA.912.DP.5.5
The Standard
Determine if a specific model is consistent within a given process by analyzing the data distribution from a data-generating process.
Florida B.E.S.T. Standards for Mathematics
Teacher's field guide
What This Standard Means
What Students Need to Do
- Students compare collected data with the distribution expected from a proposed probability model. They decide whether observed differences are ordinary random variation or evidence that the model does not fit.
What Mastery Looks Like
- Students compare an observed distribution with results predicted by a model. They use shape, center, spread, and unusual outcomes to defend whether differences are likely due to chance.
Common Misconceptions
- Students may reject a model whenever observed data do not match its predictions exactly. They may compare only the mean, ignore shape and spread, or draw strong conclusions from a small sample.
How to Assess It
- Give students this prompt: “A fair-coin simulation produced 18 to 32 heads in nearly all sets of 50 flips. One coin produced 39 heads. Is the fair-coin model reasonable? Explain.”
Lesson moves
Ways to Teach It
Students roll a die 60 times, make a frequency plot, and compare results with a uniform model and class simulations.
Ask, “How far from a model’s prediction is too far?” Students cite shape, center, spread, and unusual outcomes in a written claim.
Give pairs of observed statistics and simulation dot plots; teams sort them into consistent or inconsistent, then defend one disputed card.
Compare factory bottle-fill data with its target model, then decide whether random variation or a process problem better explains the difference.
Free download
Printable MA.912.DP.5.5 Worksheet
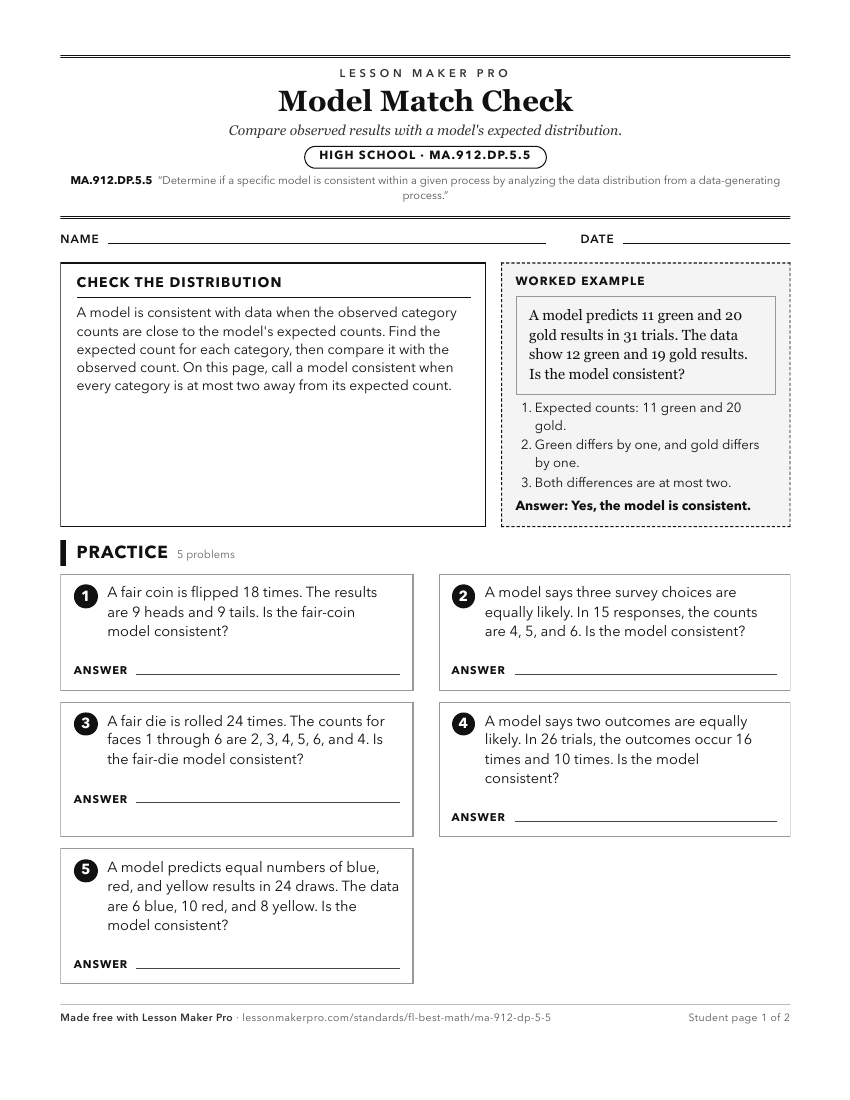
A ready-to-print activity worksheet aligned to MA.912.DP.5.5, with an answer key for the teacher on its own page. No account needed.
PDF, US Letter, prints cleanly in black and white.
Download the worksheetKeep exploring
Related Standards
- MA.6.DP.1.6
Given a real-world scenario, determine and describe how changes in data values impact measures of center and variation.
- MA.912.DP.2.1
For two or more sets of numerical univariate data, calculate and compare the appropriate measures of center and measures of variability, accounting for possible...
- MA.912.DP.6
Use probability distributions to solve problems.
- MA.912.DP.5.10
Determine whether differences between parameters are significant using simulations.
Turn this exact standard into a lesson
Grade, subject, topic, and the complete standard are prefilled. Create one free, no account needed.
Also for this standard:Make a WorksheetMake a QuizMake a Sub Lesson