Florida B.E.S.T. MA.912.DP.5.10
The Standard
Determine whether differences between parameters are significant using simulations.
Florida B.E.S.T. Standards for Mathematics
Teacher's field guide
What This Standard Means
What Students Need to Do
- Students compare an observed difference between two groups with differences produced under a chance model. They estimate how often equally or more extreme results occur, then decide whether the observed difference is statistically significant.
What Mastery Looks Like
- A student can create or interpret a randomization distribution and locate the observed difference on it. The student uses the proportion of equally or more extreme results to make and explain a significance decision.
Common Misconceptions
- Students may treat any nonzero sample difference as significant. They may randomize the data values instead of the group labels. They may think a small simulated proportion proves one parameter is larger.
How to Assess It
- Exit ticket: An observed mean difference is 8 points, and 12 of 500 shuffled trials produced an absolute difference of 8 or more. Find the simulated p-value and decide whether the result is significant at 0.05.
Lesson moves
Ways to Teach It
Give pairs labeled outcome cards, have them shuffle group labels, calculate mean differences, and build a class randomization distribution.
Ask students to explain why a rare simulated difference supports a claim that the groups differ beyond random chance.
Run a card sort matching observed differences, simulation results, p-values, and valid conclusions at a given significance level.
Analyze two study apps' test results, then shuffle app labels to judge whether the score difference could reasonably occur by chance.
Free download
Printable MA.912.DP.5.10 Worksheet
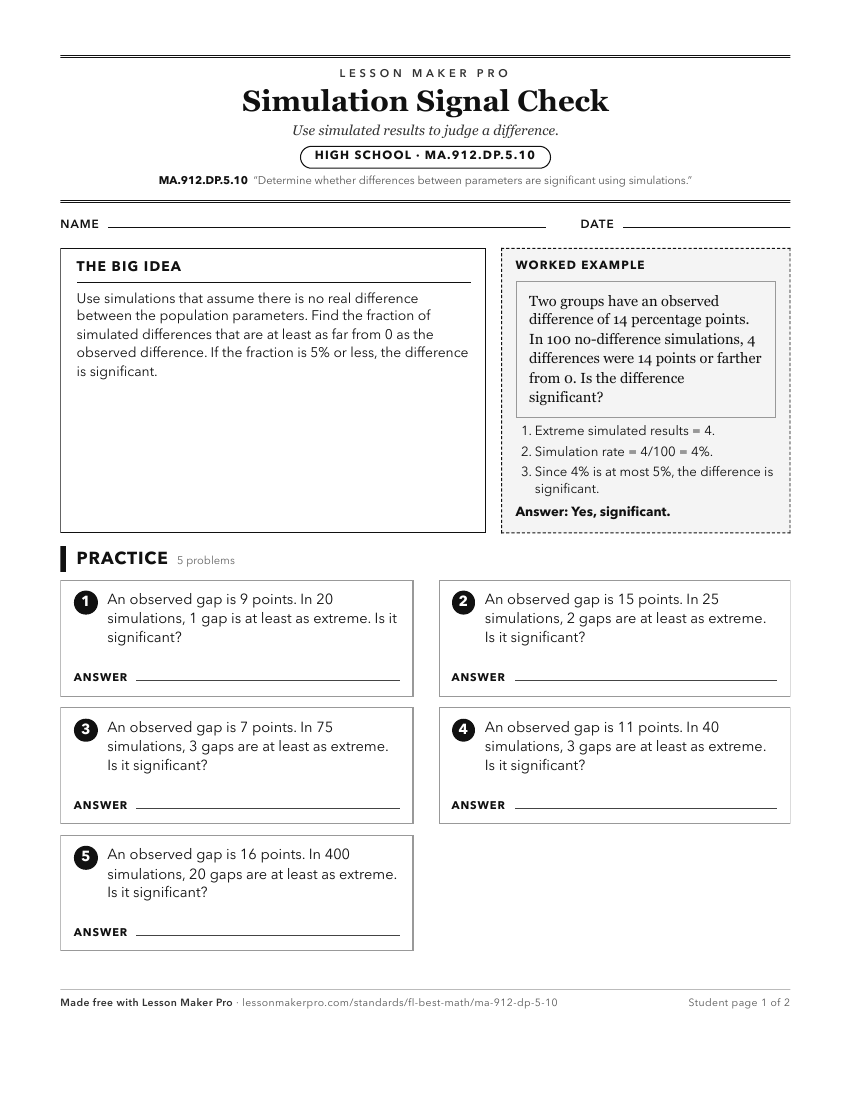
A ready-to-print activity worksheet aligned to MA.912.DP.5.10, with an answer key for the teacher on its own page. No account needed.
PDF, US Letter, prints cleanly in black and white.
Download the worksheetKeep exploring
Related Standards
- MA.912.DP.5.5
Determine if a specific model is consistent within a given process by analyzing the data distribution from a data-generating process.
- MA.912.DP.5.4
Generate multiple samples or simulated samples of the same size to measure the variation in estimates or predictions.
- MA.7.DP.2.4
Use a simulation of a simple experiment to find experimental probabilities and compare them to theoretical probabilities.
- MA.8.DP.2
Represent and find probabilities of repeated experiments.
Turn this exact standard into a lesson
Grade, subject, topic, and the complete standard are prefilled. Create one free, no account needed.
Also for this standard:Make a WorksheetMake a QuizMake a Sub Lesson