Florida B.E.S.T. MA.912.DP.6
B.E.S.T. Standard (Benchmark Cluster)
Use probability distributions to solve problems.
Florida B.E.S.T. Standards for Mathematics
Cluster contents
Benchmarks in This Standard
MA.912.DP.6 is a B.E.S.T. standard. These are the benchmarks under it.
- MA.912.DP.6.1
Define a random variable for a quantity of interest by assigning a numerical value to each individual outcome in a sample space; graph the corresponding probabi...
- MA.912.DP.6.2
Develop a probability distribution for a discrete random variable using theoretical probabilities. Find the expected value and interpret it as the mean of the d...
- MA.912.DP.6.3
Develop a probability distribution for a discrete random variable using empirical probabilities. Find the expected value and interpret it as the mean of the dis...
- MA.912.DP.6.4
Given a binomial distribution, calculate and interpret the expected value. Solve real-world problems involving binomial distributions.
- MA.912.DP.6.5
Solve real-world problems involving geometric distributions.
- MA.912.DP.6.6
Solve real-world problems involving Poisson distributions.
- MA.912.DP.6.7
Weigh the possible outcomes of a decision by assigning probabilities to payoff values and finding expected values and standard deviations. Evaluate and compare ...
- MA.912.DP.6.8
Apply probabilities to make fair decisions, such as drawing from lots or using a random number generator.
Teacher's field guide
What This Cluster Means
What Students Need to Do
- Students use tables, graphs, or formulas that show possible outcomes and their probabilities. They find event probabilities and expected values to answer questions and make decisions.
What Mastery Looks Like
- Students create or read a probability distribution and verify that it is valid. They calculate probabilities and expected values, then explain what the results mean in the problem context.
Common Misconceptions
- Students may list probabilities that do not add to 1 or confuse outcomes with their probabilities. They may treat expected value as a guaranteed result rather than a long-run average. They may also add probabilities when events overlap.
How to Assess It
- Exit ticket: A game pays $0, $5, or $20 with probabilities 0.70, 0.25, and 0.05. Find the expected payout and decide whether a $3 ticket is fair.
Lesson moves
Ways to Teach It
Roll two dice 40 times, build a distribution of sums, and compare experimental probabilities with theoretical probabilities.
Ask students to write whether an expected payout of $8 means every player wins $8, then defend their answer.
Play a matching game where students pair distribution tables with probability questions, expected values, and correct interpretations.
Compare two phone insurance plans using repair costs and probabilities, then choose the plan with the lower expected yearly cost.
Free download
Printable MA.912.DP.6 Worksheet
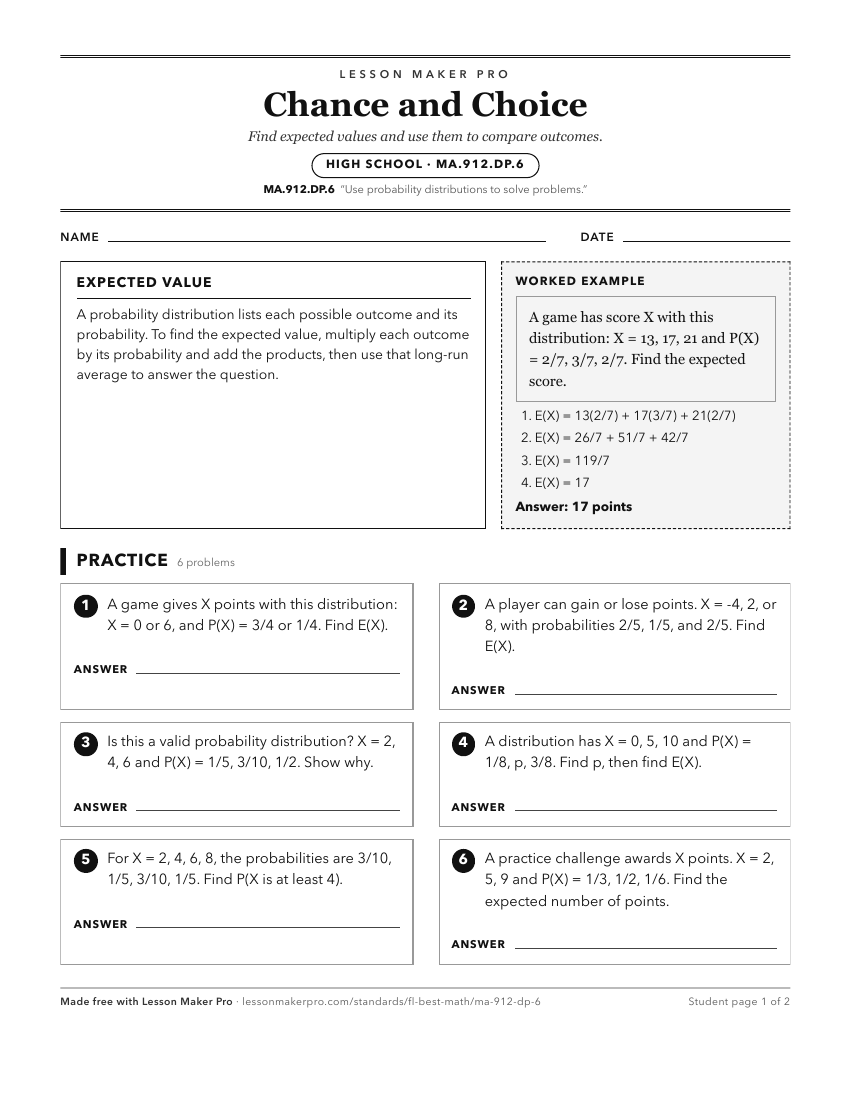
A ready-to-print activity worksheet aligned to MA.912.DP.6, with an answer key for the teacher on its own page. No account needed.
PDF, US Letter, prints cleanly in black and white.
Download the worksheetKeep exploring
Related Standards
Turn this cluster into a lesson
Grade, subject, topic, and the complete cluster are prefilled. Create one free, no account needed.
Also for this cluster:Make a WorksheetMake a QuizMake a Sub Lesson