Florida B.E.S.T. MA.7.DP.2
B.E.S.T. Standard (Benchmark Cluster)
Develop an understanding of probability. Find and compare experimental and theoretical probabilities.
Florida B.E.S.T. Standards for Mathematics
Cluster contents
Benchmarks in This Standard
MA.7.DP.2 is a B.E.S.T. standard. These are the benchmarks under it.
- MA.7.DP.2.1
Determine the sample space for a simple experiment.
- MA.7.DP.2.2
Given the probability of a chance event, interpret the likelihood of it occurring. Compare the probabilities of chance events.
- MA.7.DP.2.3
Find the theoretical probability of an event related to a simple experiment.
- MA.7.DP.2.4
Use a simulation of a simple experiment to find experimental probabilities and compare them to theoretical probabilities.
Teacher's field guide
What This Cluster Means
What Students Need to Do
- Students list possible outcomes and use equally likely outcomes to calculate the chance of an event. They run repeated trials, record relative frequencies, and compare those results with the calculated probability.
What Mastery Looks Like
- A student can calculate probabilities from a model and from trial data, then express both as fractions, decimals, or percents. The student can explain why results vary and why more trials usually produce a more stable estimate.
Common Misconceptions
- Students may assume all outcomes are equally likely, even when a spinner or sample space shows otherwise. They may expect trial results to match calculated probabilities exactly. Some divide favorable outcomes by the wrong total.
How to Assess It
- Exit ticket: A bag has 3 red, 2 blue, and 5 green counters. Find the predicted chance of red, compare it with 16 red draws out of 40 trials with replacement, and explain the difference.
Lesson moves
Ways to Teach It
Place 3 red and 7 blue counters in a bag; students predict red, draw with replacement 50 times, then compare results.
Ask: Why might two groups using identical bags get different results, and what would likely happen after 500 draws?
Play Probability Match: students pair event cards, sample spaces, and probability cards, then justify each match to a partner.
Give students 20 past 30 percent rain forecasts and outcomes; they calculate the rain rate and judge whether the forecast seems reasonable.
Free download
Printable MA.7.DP.2 Worksheet
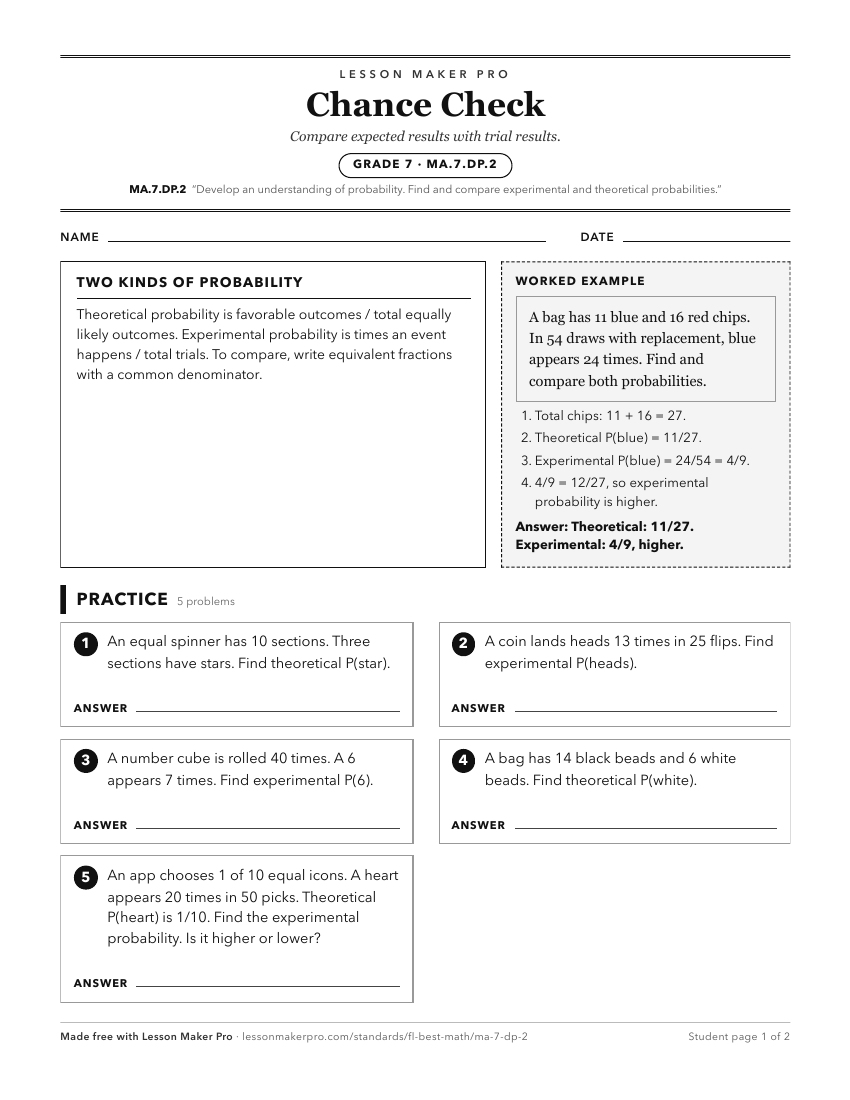
A ready-to-print activity worksheet aligned to MA.7.DP.2, with an answer key for the teacher on its own page. No account needed.
PDF, US Letter, prints cleanly in black and white.
Download the worksheetKeep exploring
Related Standards
Turn this cluster into a lesson
Grade, subject, topic, and the complete cluster are prefilled. Create one free, no account needed.
Also for this cluster:Make a WorksheetMake a QuizMake a Sub Lesson