Florida B.E.S.T. MA.912.DP.5.1
The Standard
Distinguish between a population parameter and a sample statistic.
Florida B.E.S.T. Standards for Mathematics
Teacher's field guide
What This Standard Means
What Students Need to Do
- Students decide whether a numerical summary describes an entire group or only a sample. They label it as a population parameter or sample statistic and name the group represented.
What Mastery Looks Like
- Given a study, students identify the population, sample, and numerical summary. They explain that a population parameter stays fixed, while a sample statistic can change with a new sample.
Common Misconceptions
- Students may call every calculated number a statistic, even when the whole population was measured. They may confuse the population with the sample or assume a parameter changes when a new sample is drawn. They may also treat sample size as the statistic of interest.
How to Assess It
- Exit ticket: A school has 1,200 students, and a survey of 80 finds 62% prefer later start times. Identify the population, sample, statistic, and parameter being estimated.
Lesson moves
Ways to Teach It
Fill a bag with 100 colored tiles, sample 10, and compare the sample proportion with the proportion from counting the whole bag.
Ask, "Why can two samples from the same school produce different percentages while the school's true percentage stays fixed?"
Run a card sort with study scenarios, and have teams place each number under parameter or statistic and defend one choice.
Compare a preelection poll percentage with the final vote percentage, then label each value and explain why they differ.
Free download
Printable MA.912.DP.5.1 Worksheet
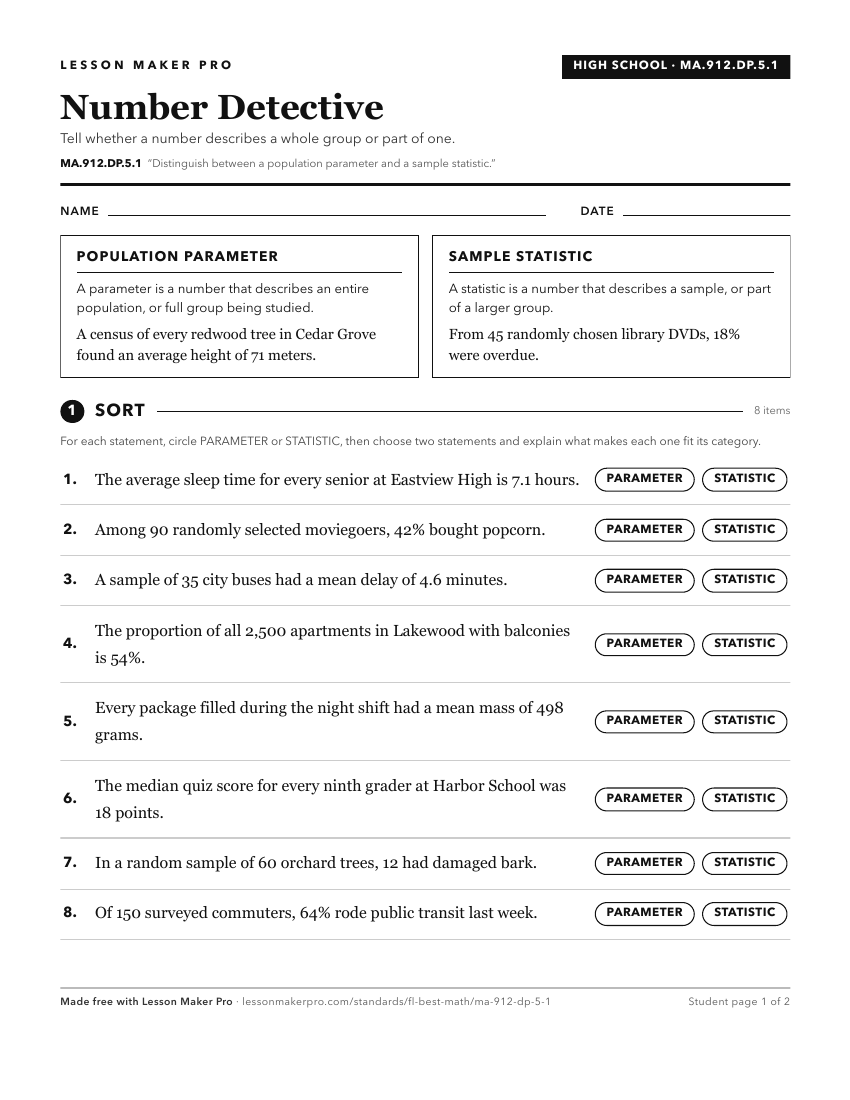
A ready-to-print activity worksheet aligned to MA.912.DP.5.1, with an answer key for the teacher on its own page. No account needed.
PDF, US Letter, prints cleanly in black and white.
Download the worksheetKeep exploring
Related Standards
- MA.912.DP.5.8
Draw inferences about two populations using data and statistical analysis from two random samples.
- MA.912.DP.1.4
Estimate a population total, mean or percentage using data from a sample survey; develop a margin of error through the use of simulation.
- MA.912.DP.5.2
Explain how random sampling produces data that is representative of a population.
- MA.912.DP.5.10
Determine whether differences between parameters are significant using simulations.
Turn this exact standard into a lesson
Grade, subject, topic, and the complete standard are prefilled. Create one free, no account needed.
Also for this standard:Make a WorksheetMake a QuizMake a Sub Lesson