Florida B.E.S.T. MA.912.DP.5.2
The Standard
Explain how random sampling produces data that is representative of a population.
Florida B.E.S.T. Standards for Mathematics
Teacher's field guide
What This Standard Means
What Students Need to Do
- Students identify a target population and use chance, not personal choice, to select a sample. They explain how random selection limits bias and usually reflects the population more closely.
What Mastery Looks Like
- Given several survey plans, students can identify which ones use random selection and explain how they reduce selection bias. They recognize that random samples can vary, while larger random samples usually give steadier estimates.
Common Misconceptions
- Students may think random means choosing whoever is nearby or picking names without a clear chance process. They may expect every random sample to match the population exactly. They may also think a large volunteer sample removes selection bias.
How to Assess It
- Exit ticket: Choose between surveying the first 50 students entering school and randomly selecting 50 names from the roster. Explain which sample is more representative and why.
Lesson moves
Ways to Teach It
Put 30 colored counters in a bag, draw 10 without looking, record each color proportion, replace them, and repeat five times.
Discuss why surveying students leaving basketball practice may misrepresent schoolwide exercise habits, then write a fairer selection plan.
Sort sample-plan cards into random, biased, or unclear, and score one point for each accurate justification.
Use a class roster and random number generator to select students for a cafeteria survey, then compare the results with volunteer responses.
Free download
Printable MA.912.DP.5.2 Worksheet
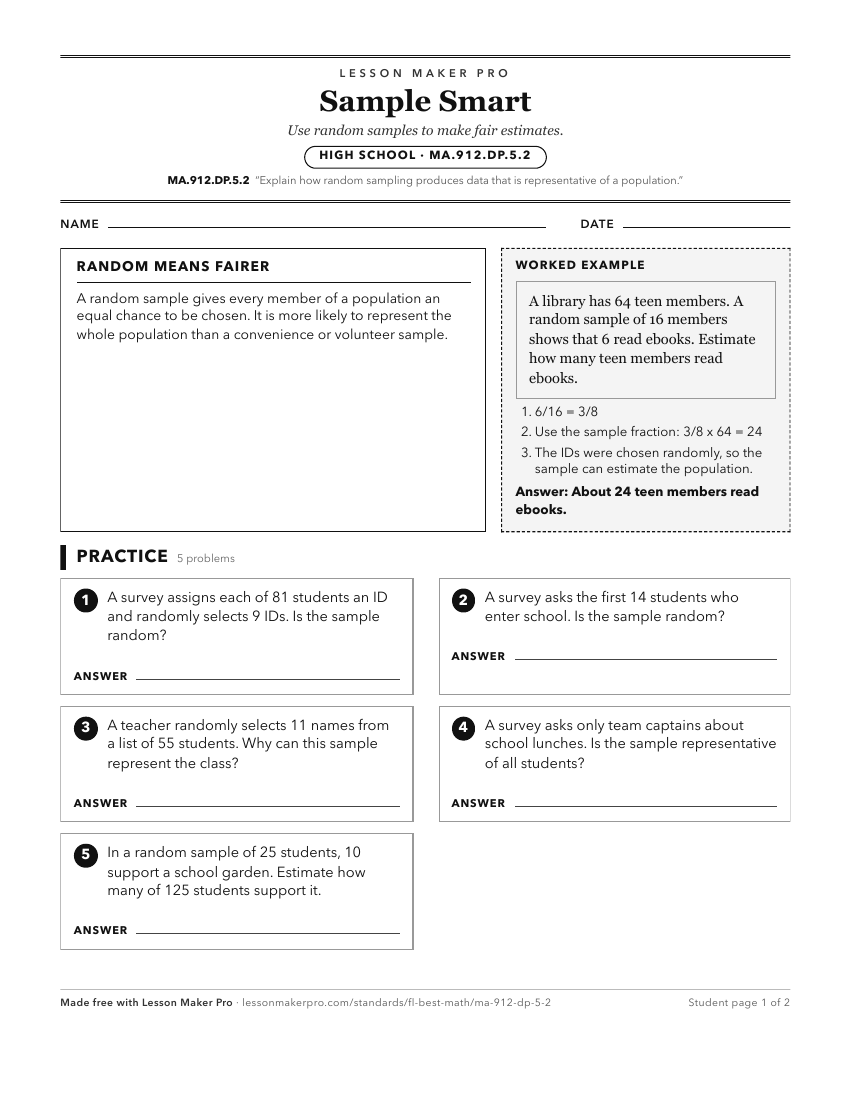
A ready-to-print activity worksheet aligned to MA.912.DP.5.2, with an answer key for the teacher on its own page. No account needed.
PDF, US Letter, prints cleanly in black and white.
Download the worksheetKeep exploring
Related Standards
- MA.7.DP.1.3
Given categorical data from a random sample, use proportional relationships to make predictions about a population.
- MA.912.DP.5.8
Draw inferences about two populations using data and statistical analysis from two random samples.
- MA.912.DP.1.4
Estimate a population total, mean or percentage using data from a sample survey; develop a margin of error through the use of simulation.
- MA.912.DP.6.1
Define a random variable for a quantity of interest by assigning a numerical value to each individual outcome in a sample space; graph the corresponding probabi...
Turn this exact standard into a lesson
Grade, subject, topic, and the complete standard are prefilled. Create one free, no account needed.
Also for this standard:Make a WorksheetMake a QuizMake a Sub Lesson