Florida B.E.S.T. MA.6.DP.1.5
The Standard
Create box plots and histograms to represent sets of numerical data within real-world contexts.
Florida B.E.S.T. Standards for Mathematics
Teacher's field guide
What This Standard Means
What Students Need to Do
- Students organize numerical data from a real situation and choose a clear, even scale. They calculate a five-number summary and interval frequencies, then draw accurate, labeled box plots and histograms.
What Mastery Looks Like
- A student finds the minimum, quartiles, median, and maximum correctly. The student also groups values accurately, uses equal-width intervals, and labels both displays with a consistent scale.
Common Misconceptions
- Students may draw gaps between histogram bars or treat each bar as one data value. They may use unequal intervals, misplace quartiles, or confuse the box length with the full range.
How to Assess It
- Exit ticket: For 5, 7, 8, 8, 9, 10, 11, 12, 12, 14, 16, 18, draw a box plot and a histogram using intervals 5–9, 10–14, and 15–19.
Lesson moves
Ways to Teach It
Give pairs data cards to sort, then have them build a box plot on a taped floor number line.
Ask students to explain which display better shows clusters and which better shows the median and spread.
Play Data Display Match by having teams pair data sets with prepared box plots and histograms.
Collect class commute times, then create both displays and write two observations about the distribution.
Free download
Printable MA.6.DP.1.5 Worksheet
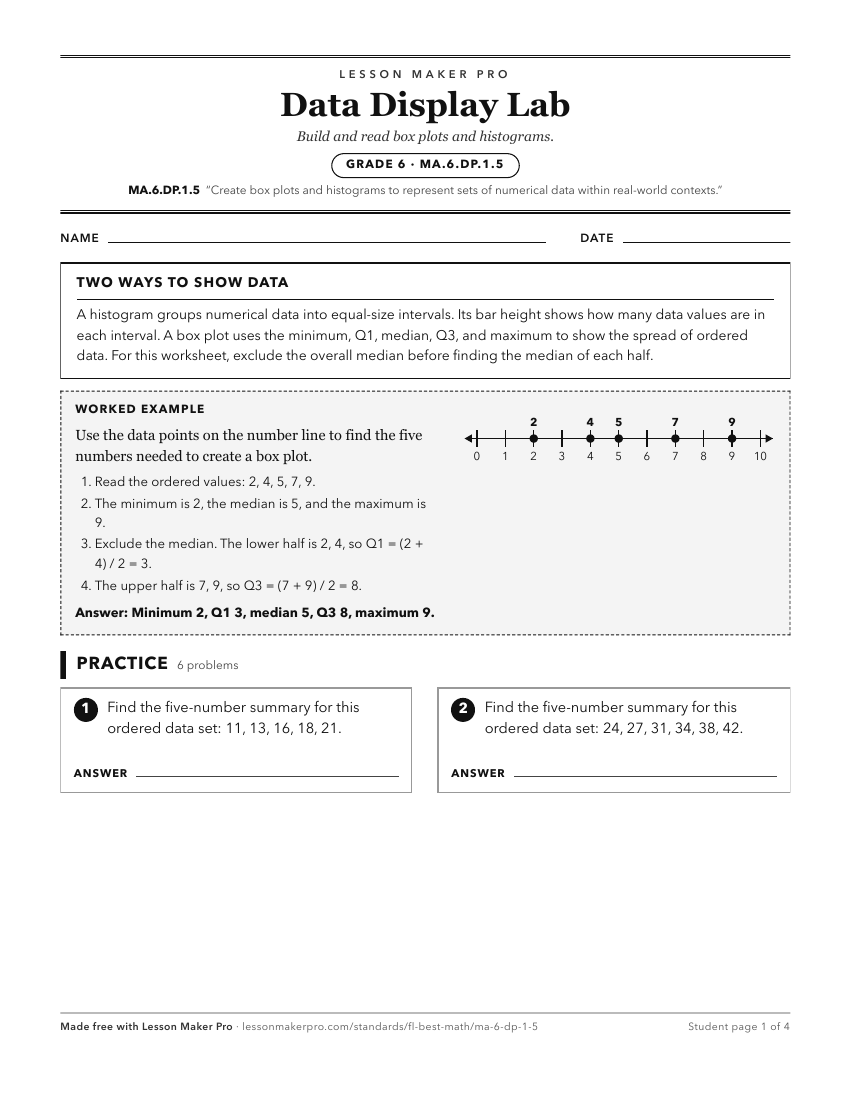
A ready-to-print activity worksheet aligned to MA.6.DP.1.5, with an answer key for the teacher on its own page. No account needed.
PDF, US Letter, prints cleanly in black and white.
Download the worksheetKeep exploring
Related Standards
- MA.6.DP.1.3
Given a box plot within a real-world context, determine the minimum, the lower quartile, the median, the upper quartile and the maximum. Use this summary of the...
- MA.6.DP.1.4
Given a histogram or line plot within a real-world context, qualitatively describe and interpret the spread and distribution of the data, including any symmetry...
- MA.8.DP.1.1
Given a set of real-world bivariate numerical data, construct a scatter plot or a line graph as appropriate for the context.
- MA.7.DP.1.5
Given a real-world numerical or categorical data set, choose and create an appropriate graphical representation.
Turn this exact standard into a lesson
Grade, subject, topic, and the complete standard are prefilled. Create one free, no account needed.
Also for this standard:Make a WorksheetMake a QuizMake a Sub Lesson