Florida B.E.S.T. MA.6.DP.1.3
The Standard
Given a box plot within a real-world context, determine the minimum, the lower quartile, the median, the upper quartile and the maximum. Use this summary of the data to describe the spread and distribution of the data.
Florida B.E.S.T. Standards for Mathematics
Teacher's field guide
What This Standard Means
What Students Need to Do
- Students read the five key values shown by the whiskers, box edges, and median line. They use those values to describe the overall range, middle half, and how the data are spread.
What Mastery Looks Like
- Students correctly read all five key values from the scale. They use the range, interquartile range, and unequal section lengths to compare spread and describe how values are distributed.
Common Misconceptions
- Students may read box widths as frequencies or assume each section contains the same numerical range. They may confuse quartiles with individual data values or calculate range using the edges of the box instead of the whiskers.
How to Assess It
- Give students a box plot of daily temperatures. Ask them to list the five key values, find the range, and write one sentence describing where the middle half lies.
Lesson moves
Ways to Teach It
Give groups number cards to order, find quartiles, and build a floor-sized box plot with string and sticky notes.
Show two box plots and ask, “Which data set is more spread out, and what evidence from the plots supports your answer?”
Play Box Plot Match by having students pair five-number summary cards with the correct box plot cards.
Use box plots of bus travel times to identify typical times, compare consistency, and discuss which route is more reliable.
Free download
Printable MA.6.DP.1.3 Worksheet
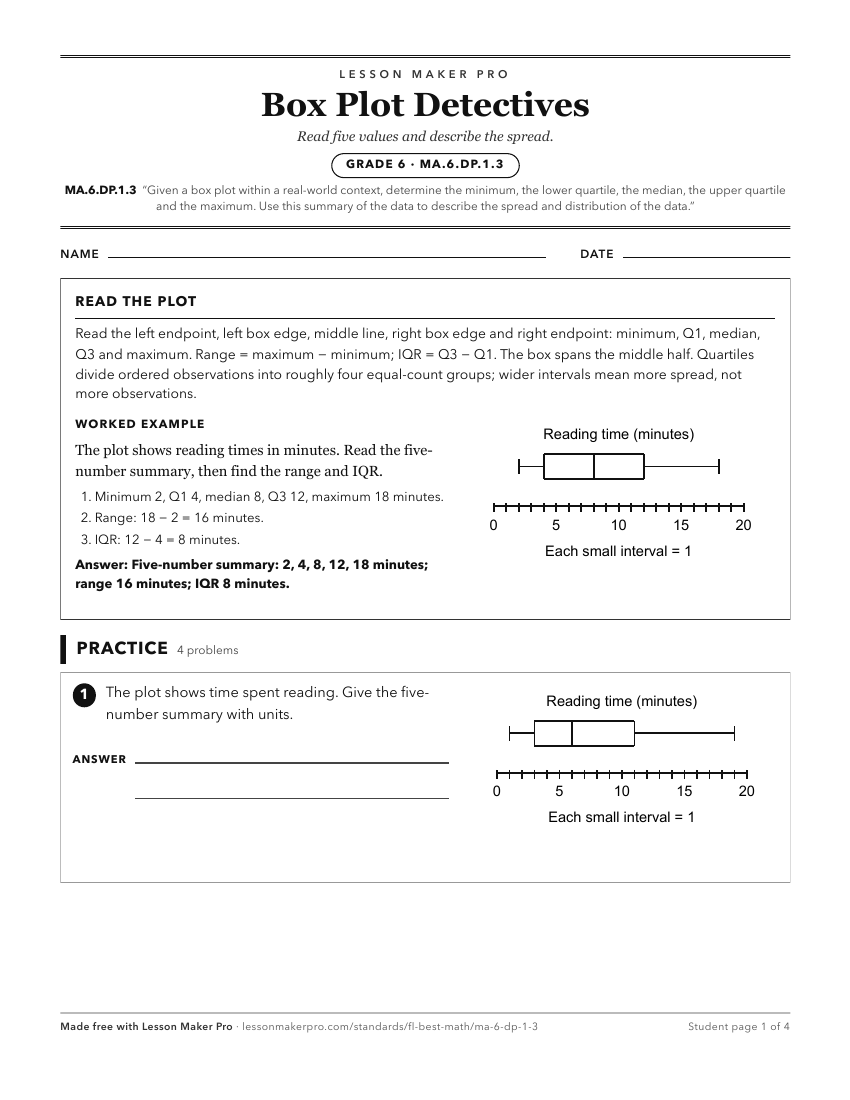
A ready-to-print activity worksheet aligned to MA.6.DP.1.3, with an answer key for the teacher on its own page. No account needed.
PDF, US Letter, prints cleanly in black and white.
Download the worksheetKeep exploring
Related Standards
- MA.6.DP.1.5
Create box plots and histograms to represent sets of numerical data within real-world contexts.
- MA.6.DP.1.4
Given a histogram or line plot within a real-world context, qualitatively describe and interpret the spread and distribution of the data, including any symmetry...
- MA.6.DP.1.2
Given a numerical data set within a real-world context, find and interpret mean, median, mode and range.
- MA.4.DP.1
Collect, represent and interpret data and find the mode, median and range of a data set.
Turn this exact standard into a lesson
Grade, subject, topic, and the complete standard are prefilled. Create one free, no account needed.
Also for this standard:Make a WorksheetMake a QuizMake a Sub Lesson