Florida B.E.S.T. MA.912.DP.2.7
The Standard
Compute the correlation coefficient of a linear model using technology. Interpret the strength and direction of the correlation coefficient.
Florida B.E.S.T. Standards for Mathematics
Teacher's field guide
What This Standard Means
What Students Need to Do
- Students use a calculator, spreadsheet, or graphing tool to compute the correlation coefficient for paired numerical data. They explain whether the relationship is positive or negative and weak, moderate, or strong.
What Mastery Looks Like
- Students enter paired data correctly and use a calculator or spreadsheet to find the correlation coefficient. They describe values near 1 or -1 as strong and values near 0 as weak, using the data context.
Common Misconceptions
- Students may treat a negative value as weaker than a positive value, even when its absolute value is larger. They may confuse correlation with slope or claim that correlation proves causation.
How to Assess It
- Give the pairs (1, 2), (2, 3), (3, 5), (4, 4), and (5, 7). Students use technology to find r, then describe its strength and direction in one sentence.
Lesson moves
Ways to Teach It
In pairs, measure classmates' hand spans and heights, enter the data in a spreadsheet, and interpret the resulting correlation coefficient.
Ask students to compare r = 0.82 and r = -0.91, then explain which relationship is stronger and why.
Give groups cards showing scatterplots and correlation coefficients, then have them race to match each plot with the most reasonable value.
Collect mileage and price from ten used-car listings, compute the correlation coefficient, and explain what the result suggests about the market.
Free download
Printable MA.912.DP.2.7 Worksheet
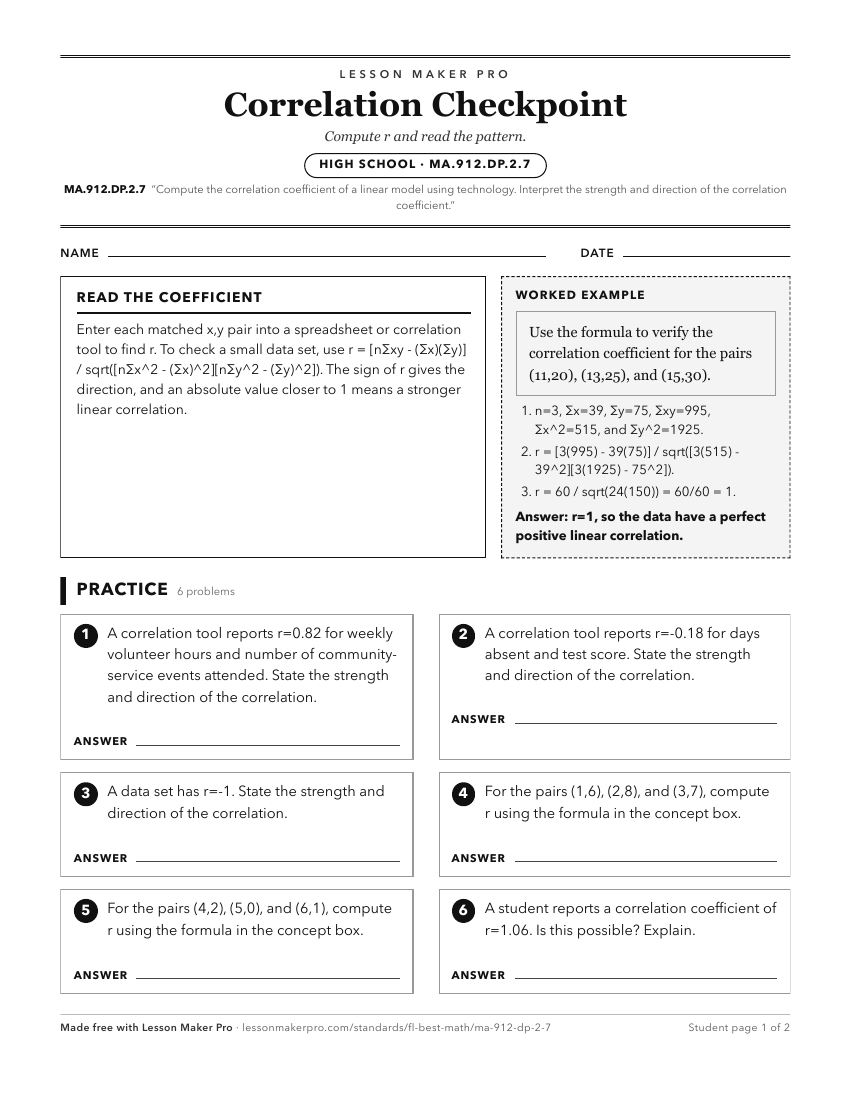
A ready-to-print activity worksheet aligned to MA.912.DP.2.7, with an answer key for the teacher on its own page. No account needed.
PDF, US Letter, prints cleanly in black and white.
Download the worksheetKeep exploring
Related Standards
- MA.912.DP.2.6
Given a scatter plot with a line of fit and residuals, determine the strength and direction of the correlation. Interpret strength and direction within a real-w...
- MA.912.DP.2.5
Given a scatter plot that represents bivariate numerical data, assess the fit of a given linear function by plotting and analyzing residuals.
- MA.912.DP.2.4
Fit a linear function to bivariate numerical data that suggests a linear association and interpret the slope and y-intercept of the model. Use the model to solv...
- MA.912.DP.2.8
Fit a quadratic function to bivariate numerical data that suggests a quadratic association and interpret any intercepts or the vertex of the model. Use the mode...
Turn this exact standard into a lesson
Grade, subject, topic, and the complete standard are prefilled. Create one free, no account needed.
Also for this standard:Make a WorksheetMake a QuizMake a Sub Lesson