Virginia SOL 1.PS.1
SOL Standard (Knowledge and Skills Cluster)
The student will apply the data cycle (pose questions; collect or acquire data; organize and represent data; and analyze data and communicate results) with a focus on object graphs, picture graphs, and tables.
Virginia Standards of Learning for Mathematics
Cluster contents
Knowledge and Skills in This Standard
1.PS.1 is a Standards of Learning standard. These are the knowledge and skills expectations under it.
- 1.PS.1.a
Sort and classify concrete objects into appropriate subsets (categories) based on one or two attributes, such as size, shape, color, and/or thickness (e.g., sor...
- 1.PS.1.b
Describe and label attributes of a set of objects that has been sorted.
- 1.PS.1.c
Pose questions, given a predetermined context, that require the collection of data (limited to 25 or fewer data points for no more than four categories).
- 1.PS.1.d
Determine the data needed to answer a posed question and collect the data using various methods (e.g., counting objects, drawing pictures, tallying).
- 1.PS.1.e
Organize and represent a data set by sorting the collected data using various methods (e.g., tallying, T-charts).
- 1.PS.1.f
Represent a data set (vertically or horizontally) using object graphs, picture graphs, and tables.
- 1.PS.1.g.i
ask and answer questions about the data represented in object graphs, picture graphs, and tables (e.g., total number of data points represented, how many in eac...
- 1.PS.1.g.ii
draw conclusions about the data and make predictions based on the data.
Teacher's field guide
What This Cluster Means
What Students Need to Do
- Students sort objects by one or two features, then gather and record up to 25 pieces of data. They make object graphs, picture graphs, or tables and use them to compare groups, find totals, answer questions, and make predictions.
What Mastery Looks Like
- A student can choose the needed data, collect it accurately, and place each item in the correct category. The student can make a labeled graph or table, find totals and differences, and state a conclusion supported by the display.
Common Misconceptions
- Students may sort by color but ignore a second feature, such as shape. They may leave categories unlabeled, record totals incorrectly, or draw graph symbols that do not match the data. They may reverse “more” and “fewer” or compare groups without finding the difference.
How to Assess It
- Give students 12 cards showing red circles, red squares, blue circles, and blue squares. Ask them to sort the cards, complete a four-category table, and write one comparison supported by the data.
Lesson moves
Ways to Teach It
Pairs sort 20 buttons by color and number of holes, label each group, then arrange the buttons as a horizontal object graph.
Display a class snack picture graph and ask, “Which snack was chosen most, and how many more votes did it receive?”
Teams draw question cards asking for a category count, total, difference, or prediction, then answer using a prepared picture graph.
Survey how classmates travel to school, record responses with tally marks, build a table, and share one conclusion about class transportation.
Free download
Printable 1.PS.1 Worksheet
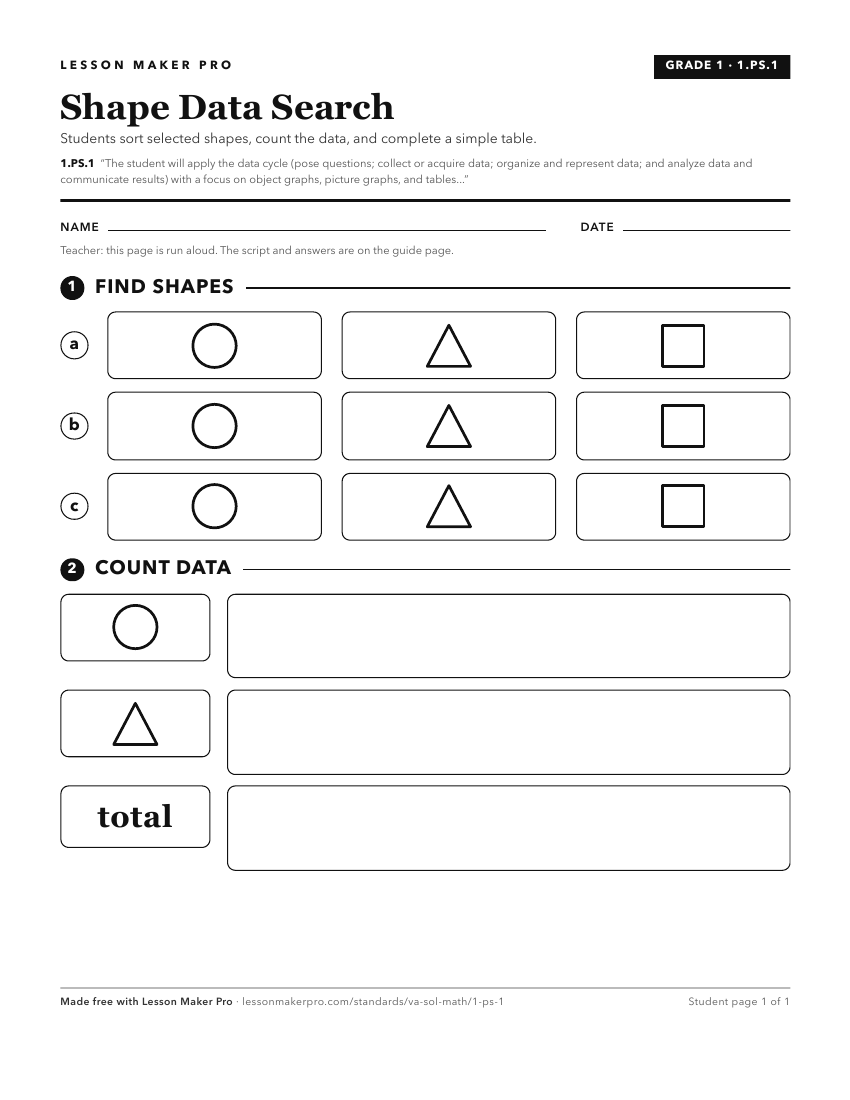
A ready-to-print activity worksheet aligned to 1.PS.1, with an answer key for the teacher on its own page. No account needed.
PDF, US Letter, prints cleanly in black and white.
Download the worksheetKeep exploring
Related Standards
- 4.PS.1
The student will apply the data cycle (formulate questions; collect or acquire data; organize and represent data; and analyze data and communicate results) with...
- K.PS.1
The student will apply the data cycle (pose questions; collect or acquire data; organize and represent data; and analyze data and communicate results) with a fo...
- 6.PS.1
The student will apply the data cycle (formulate questions; collect or acquire data; organize and represent data; and analyze data and communicate results) with...
- 2.PS.1
The student will apply the data cycle (pose questions; collect or acquire data; organize and represent data; and analyze data and communicate results) with a fo...
Turn this cluster into a lesson
Grade, subject, topic, and the complete cluster are prefilled. Create one free, no account needed.
Also for this cluster:Make a WorksheetMake a QuizMake a Sub Lesson