Virginia SOL 1.PS.1.f
The Standard
Represent a data set (vertically or horizontally) using object graphs, picture graphs, and tables.
Virginia Standards of Learning for Mathematics · The student will apply the data cycle (pose questions; collect or acquire data; organize and represent data; and analyze data and communicate results) with a focus on object graphs, picture graphs, and tables.
Teacher's field guide
What This Standard Means
What Students Need to Do
- Students decide which items belong in each category, then count each group. They place one object or symbol for each item and record matching totals in a table. They can arrange categories across or down without changing the data.
What Mastery Looks Like
- A student builds a complete display with clear category labels and one object or picture matched to each item. The table and graphs show identical totals, whether categories run across or down.
Common Misconceptions
- Students may place a picture between categories, count labels, or change totals when turning a vertical display sideways. They may leave a table unlabeled or record the overall total instead of each category count.
How to Assess It
- Give each student four red, three blue, and two yellow counters. Ask students to show the data in a table, a vertical object graph, and a horizontal picture graph.
Lesson moves
Ways to Teach It
Give pairs buttons in three colors, a sorting mat, and sticky notes to build matching vertical and horizontal object graphs.
Show vertical and horizontal graphs of the same pet data, then ask, “What stayed the same, and what changed?”
Play Graph Match: students pair cards showing a data table, an object graph, and a picture graph for the same set.
Survey classmates about how they travel to school, then make a labeled table and picture graph for the results.
Free download
Printable 1.PS.1.f Worksheet
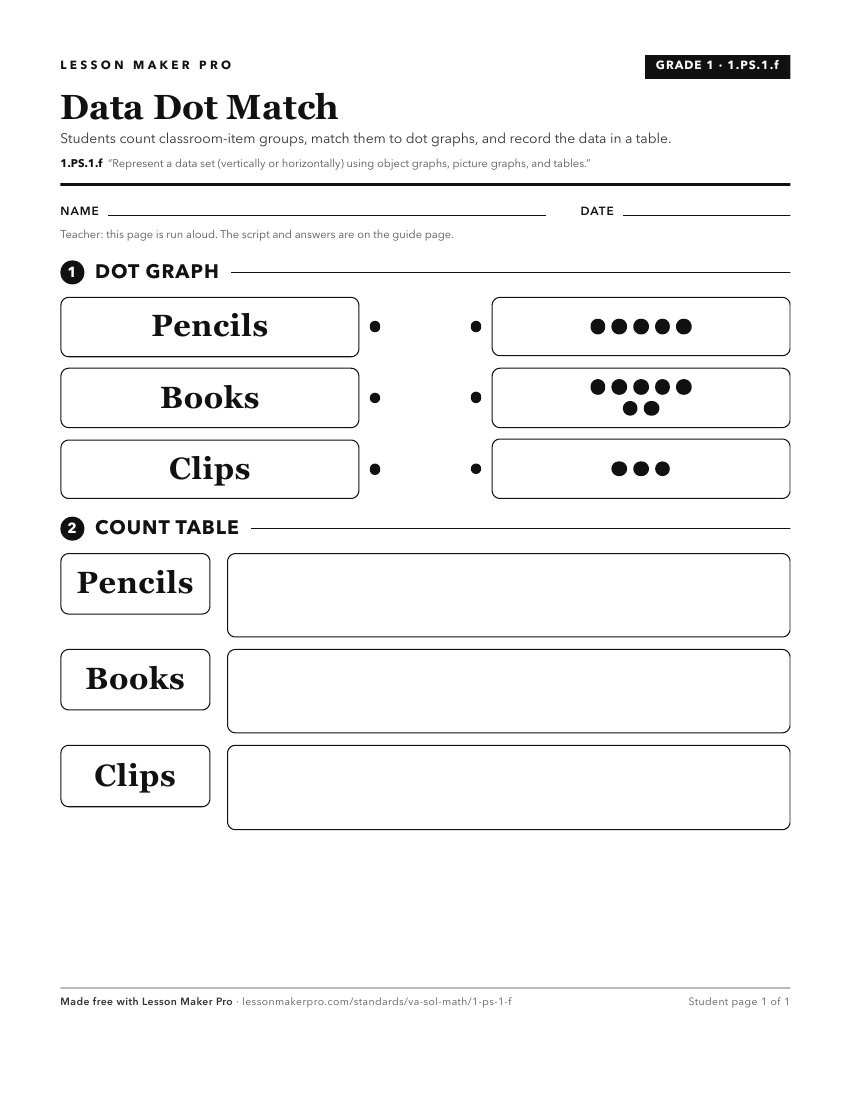
A ready-to-print activity worksheet aligned to 1.PS.1.f, with an answer key for the teacher on its own page. No account needed.
PDF, US Letter, prints cleanly in black and white.
Download the worksheetKeep exploring
Related Standards
- K.PS.1.g.i
ask and answer questions about the data represented in object graphs and picture graphs (e.g., how many in each category, which categories have the greatest, le...
- K.PS.1.f
Organize and represent a data set (vertically or horizontally) using pictures to form a simple picture graph.
- 1.PS.1.g.i
ask and answer questions about the data represented in object graphs, picture graphs, and tables (e.g., total number of data points represented, how many in eac...
- K.PS.1.e
Organize and represent a data set (vertically or horizontally) by sorting concrete objects into organized groups to form a simple object graph.
Turn this exact standard into a lesson
Grade, subject, topic, and the complete standard are prefilled. Create one free, no account needed.
Also for this standard:Make a WorksheetMake a QuizMake a Sub Lesson