Virginia SOL 1.PS.1.g.i
The Standard
ask and answer questions about the data represented in object graphs, picture graphs, and tables (e.g., total number of data points represented, how many in each category, how many more or less are in one category than another)
Virginia Standards of Learning for Mathematics · The student will apply the data cycle (pose questions; collect or acquire data; organize and represent data; and analyze data and communicate results) with a focus on object graphs, picture graphs, and tables.
Teacher's field guide
What This Standard Means
What Students Need to Do
- Students read object graphs, picture graphs, and tables to find category counts and totals. They ask and answer questions about which category has more, less, or the same amount.
What Mastery Looks Like
- Students correctly find totals and category counts in object graphs, picture graphs, and tables. They compare two categories and explain their answer using numbers from the display.
Common Misconceptions
- Students may count category labels or table headings as data. They may name the larger category when asked “how many more” instead of finding the difference. They may also miss items arranged unevenly.
How to Assess It
- Give an exit ticket with a table showing 5 apples, 3 bananas, and 4 oranges. Ask for the total, each category count, and how many more apples than bananas.
Lesson moves
Ways to Teach It
Give pairs linking cubes to sort by color, build an object graph, and answer teacher-made question cards about totals and differences.
Show a picture graph and ask, “What question can you ask that uses two categories?” Then have partners answer it.
Play Graph Detective by giving clues such as, “I have two fewer votes than cats,” and letting students identify the category.
Survey classmates about favorite playground activities, record results in a table, and decide which activity the class prefers most.
Free download
Printable 1.PS.1.g.i Worksheet
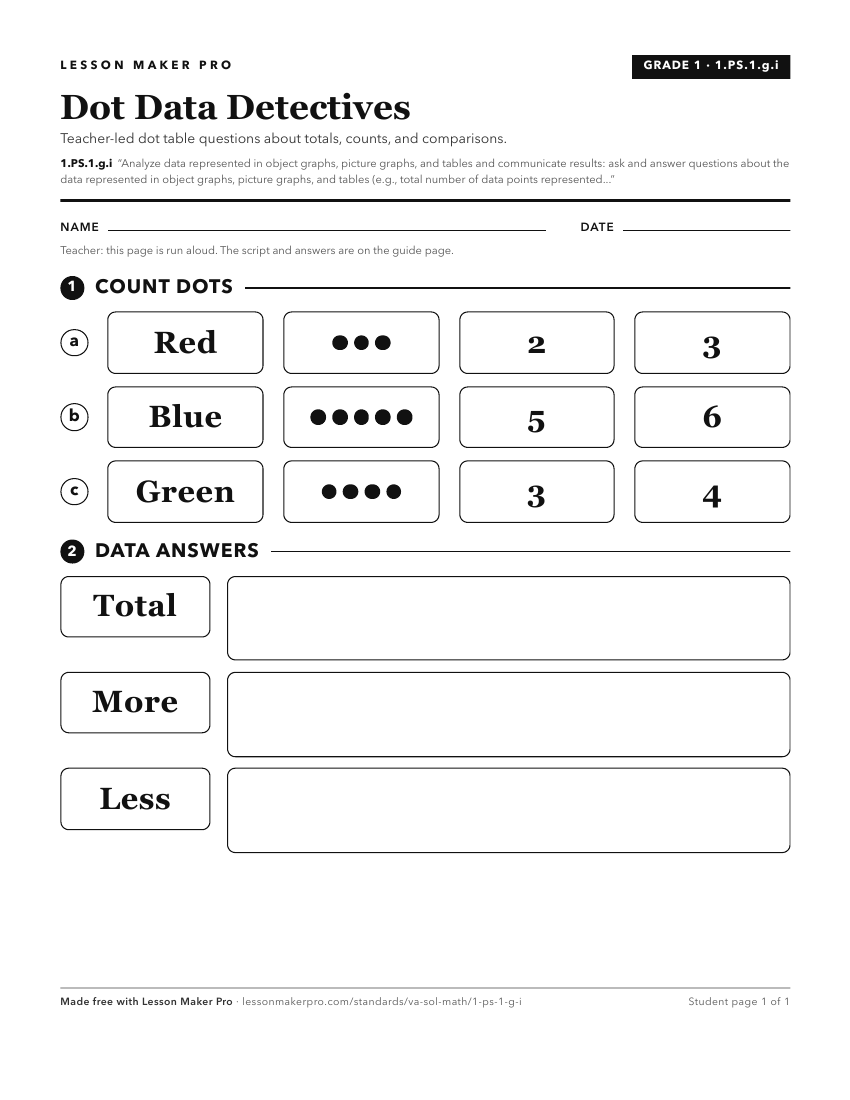
A ready-to-print activity worksheet aligned to 1.PS.1.g.i, with an answer key for the teacher on its own page. No account needed.
PDF, US Letter, prints cleanly in black and white.
Download the worksheetKeep exploring
Related Standards
- K.PS.1.g.i
ask and answer questions about the data represented in object graphs and picture graphs (e.g., how many in each category, which categories have the greatest, le...
- 1.PS.1.f
Represent a data set (vertically or horizontally) using object graphs, picture graphs, and tables.
- K.PS.1
The student will apply the data cycle (pose questions; collect or acquire data; organize and represent data; and analyze data and communicate results) with a fo...
- 2.PS.1.e.i
ask and answer questions about the data represented in pictographs and bar graphs (e.g., total number of data points represented, how many in each category, how...
Turn this exact standard into a lesson
Grade, subject, topic, and the complete standard are prefilled. Create one free, no account needed.
Also for this standard:Make a WorksheetMake a QuizMake a Sub Lesson