Virginia SOL K.PS.1.f
The Standard
Organize and represent a data set (vertically or horizontally) using pictures to form a simple picture graph.
Virginia Standards of Learning for Mathematics · The student will apply the data cycle (pose questions; collect or acquire data; organize and represent data; and analyze data and communicate results) with a focus on object graphs and picture graphs.
Teacher's field guide
What This Standard Means
What Students Need to Do
- Students sort data into labeled groups and draw a picture for each item. They arrange the pictures in clear rows or columns so the amounts can be seen easily.
What Mastery Looks Like
- Students place each picture in the correct labeled category and use one picture for each item. Their pictures line up clearly, whether the graph runs across or up and down.
Common Misconceptions
- Students may draw one picture for a whole category instead of one picture for each item. They may put pictures in the wrong row or column, leave uneven gaps, or start categories at different points. Some think a horizontal graph shows different data from a vertical graph.
How to Assess It
- Give students data showing 3 cats, 1 fish, and 4 dogs. Ask them to draw one symbol for each pet in the correct section of a labeled grid.
Lesson moves
Ways to Teach It
Give pairs bags containing red, blue, and yellow cubes; students sort them, then draw one matching circle for each cube on a grid.
Show vertical and horizontal picture graphs of the same pet data; ask, “How are they alike, and how are they different?”
Play Graph Builder: call out a category card and quantity, and students add that many symbols to the correct row.
Survey classmates about how they travel to school, then use bus, car, and shoe pictures to graph the results.
Free download
Printable K.PS.1.f Worksheet
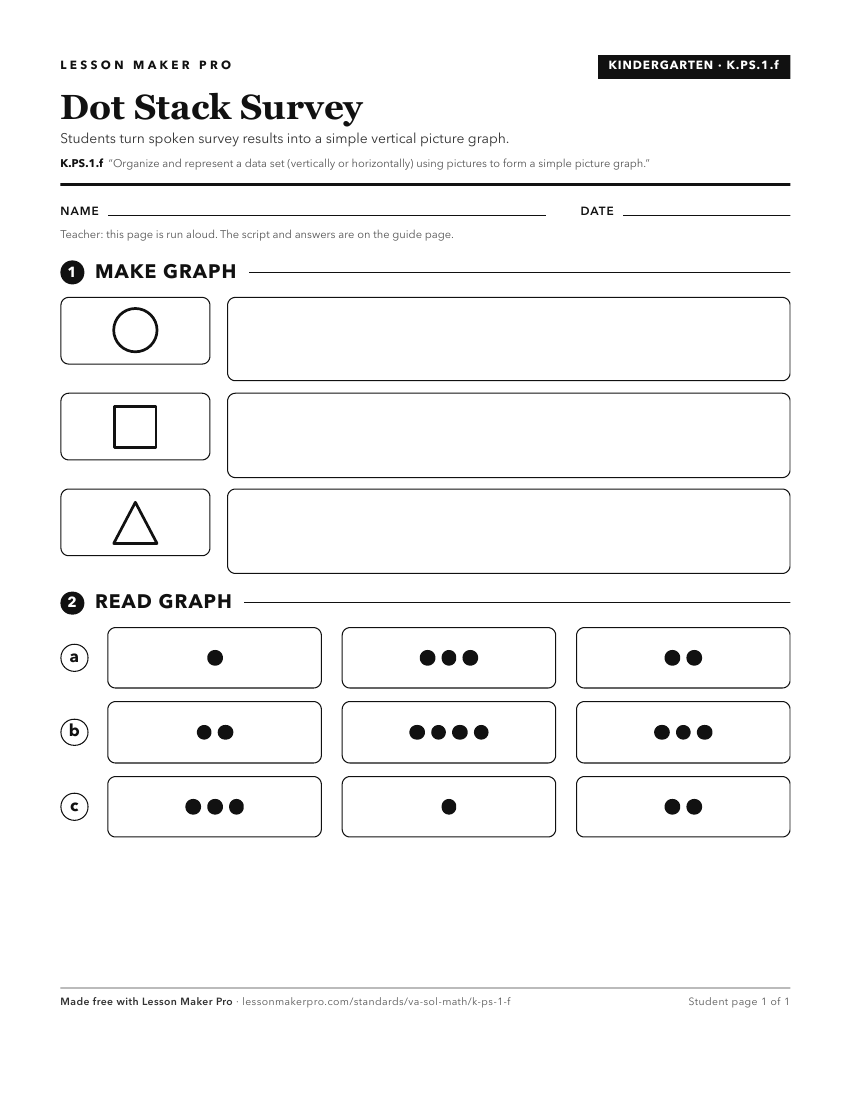
A ready-to-print activity worksheet aligned to K.PS.1.f, with an answer key for the teacher on its own page. No account needed.
PDF, US Letter, prints cleanly in black and white.
Download the worksheetKeep exploring
Related Standards
- 1.PS.1.f
Represent a data set (vertically or horizontally) using object graphs, picture graphs, and tables.
- 2.PS.1.c
Organize and represent a data set using a pictograph where each symbol represents up to 2 data points. Determine and use a key to assist in the analysis of the ...
- 3.PS.1.c
Organize and represent a data set using pictographs that include an appropriate title, labeled axes, and key. Each pictograph symbol should represent 1, 2, 5 or...
- K.PS.1.e
Organize and represent a data set (vertically or horizontally) by sorting concrete objects into organized groups to form a simple object graph.
Turn this exact standard into a lesson
Grade, subject, topic, and the complete standard are prefilled. Create one free, no account needed.
Also for this standard:Make a WorksheetMake a QuizMake a Sub Lesson