Virginia SOL 3.PS.1.c
The Standard
Organize and represent a data set using pictographs that include an appropriate title, labeled axes, and key. Each pictograph symbol should represent 1, 2, 5 or 10 data points.
Virginia Standards of Learning for Mathematics · The student will apply the data cycle (formulate questions; collect or acquire data; organize and represent data; and analyze data and communicate results) with a focus on pictographs and bar graphs.
Teacher's field guide
What This Standard Means
What Students Need to Do
- Students turn a data set into a pictograph. They choose a useful value for each symbol, then add a clear title, axis labels, and key.
What Mastery Looks Like
- Students create an accurate pictograph with a clear title, labeled axes, and a correct key. They use the key to explain each category total and compare categories.
Common Misconceptions
- Students may count pictures instead of using the value in the key. They may leave out the key, title, or axis labels. They may also choose a symbol value that does not fit the data evenly.
How to Assess It
- Exit ticket: Graph tag 10, soccer 20, jump rope 15, and four square 5 using one symbol for 5 students. Include a title, labeled axes, and key.
Lesson moves
Ways to Teach It
Give pairs category cards and stickers, then have them graph class pet data using one sticker for two votes.
Show the same data with keys of 1 and 5, then ask students which key works better and why.
Run an error hunt where students correct pictographs with missing labels, incorrect totals, or mismatched keys.
Use cafeteria lunch counts and let each plate icon represent 10 meals served.
Free download
Printable 3.PS.1.c Worksheet
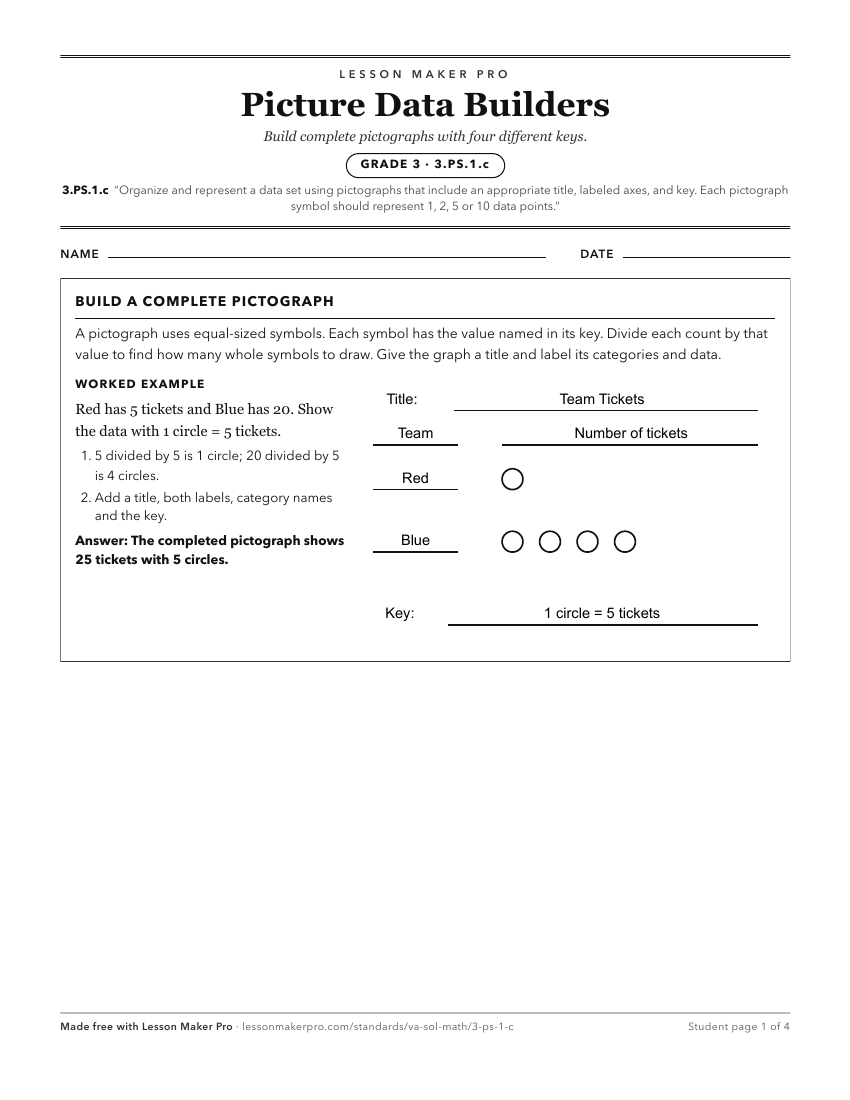
A ready-to-print activity worksheet aligned to 3.PS.1.c, with an answer key for the teacher on its own page. No account needed.
PDF, US Letter, prints cleanly in black and white.
Download the worksheetKeep exploring
Related Standards
- K.PS.1.f
Organize and represent a data set (vertically or horizontally) using pictures to form a simple picture graph.
- 2.PS.1.d
Organize and represent a data set using a bar graph with a title and labeled axes (limited to 25 or fewer data points for up to six categories, and limit increm...
- 3.PS.1.d
Organize and represent a data set using bar graphs with a title and labeled axes, with and without the use of technology tools. Determine and use an appropriate...
- 2.PS.1.c
Organize and represent a data set using a pictograph where each symbol represents up to 2 data points. Determine and use a key to assist in the analysis of the ...
Turn this exact standard into a lesson
Grade, subject, topic, and the complete standard are prefilled. Create one free, no account needed.
Also for this standard:Make a WorksheetMake a QuizMake a Sub Lesson