Virginia SOL 1.PS.1.e
The Standard
Organize and represent a data set by sorting the collected data using various methods (e.g., tallying, T-charts).
Virginia Standards of Learning for Mathematics · The student will apply the data cycle (pose questions; collect or acquire data; organize and represent data; and analyze data and communicate results) with a focus on object graphs, picture graphs, and tables.
Teacher's field guide
What This Standard Means
What Students Need to Do
- Students sort collected items or responses into groups using one clear rule. They record the groups with tallies or a T-chart so each item is counted once.
What Mastery Looks Like
- Students sort every item by a clear rule and place it in the correct category. They record one tally for each item and confirm that the tallies match the number of items collected.
Common Misconceptions
- Students may group the same item in more than one category or leave items out. They may write a numeral instead of one tally per item, or forget to make the fifth tally cross the first four.
How to Assess It
- Give students 10 shape cards and a two-column T-chart labeled “circles” and “not circles.” Ask them to sort the cards, record tallies, and explain how they checked the total.
Lesson moves
Ways to Teach It
Give pairs a bag of colored counters to sort, then record each color with tallies on a T-chart.
Ask, “Should a striped red button be sorted by color or pattern?” and have students explain which rule they chose.
Play Tally Sort Relay, where teams draw picture cards, place them into categories, and add one correct tally.
Survey classmates about their trip to school, then organize responses such as bus, car, walking, and bicycle in a tally table.
Free download
Printable 1.PS.1.e Worksheet
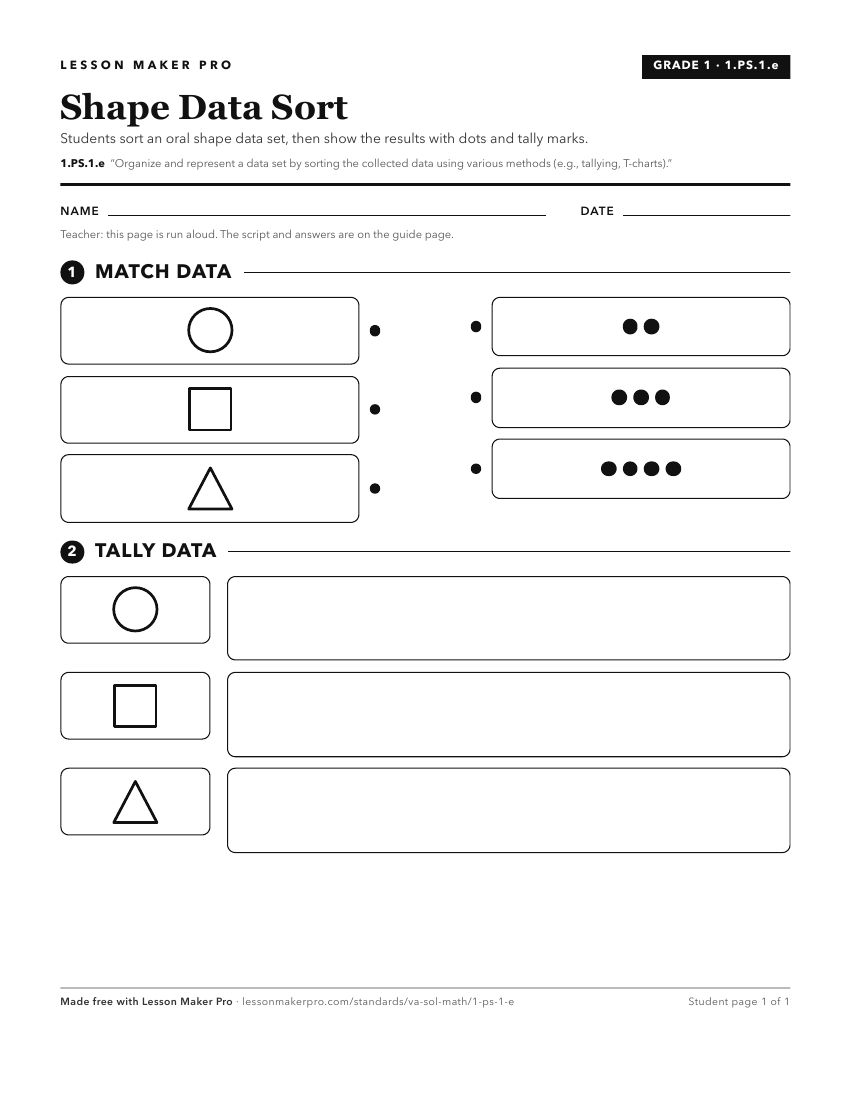
A ready-to-print activity worksheet aligned to 1.PS.1.e, with an answer key for the teacher on its own page. No account needed.
PDF, US Letter, prints cleanly in black and white.
Download the worksheetKeep exploring
Related Standards
- 1.PS.1.f
Represent a data set (vertically or horizontally) using object graphs, picture graphs, and tables.
- K.PS.1.f
Organize and represent a data set (vertically or horizontally) using pictures to form a simple picture graph.
- 2.PS.1.b
Determine the data needed to answer a posed question and collect the data using various methods (e.g., voting; creating lists, tables, or charts; tallying).
- K.PS.1.e
Organize and represent a data set (vertically or horizontally) by sorting concrete objects into organized groups to form a simple object graph.
Turn this exact standard into a lesson
Grade, subject, topic, and the complete standard are prefilled. Create one free, no account needed.
Also for this standard:Make a WorksheetMake a QuizMake a Sub Lesson