Virginia SOL 2.PS.1
SOL Standard (Knowledge and Skills Cluster)
The student will apply the data cycle (pose questions; collect or acquire data; organize and represent data; and analyze data and communicate results) with a focus on pictographs and bar graphs.
Virginia Standards of Learning for Mathematics
Cluster contents
Knowledge and Skills in This Standard
2.PS.1 is a Standards of Learning standard. These are the knowledge and skills expectations under it.
- 2.PS.1.a
Pose questions, given a predetermined context, that require the collection of data (limited to 25 or fewer data points for no more than six categories).
- 2.PS.1.b
Determine the data needed to answer a posed question and collect the data using various methods (e.g., voting; creating lists, tables, or charts; tallying).
- 2.PS.1.c
Organize and represent a data set using a pictograph where each symbol represents up to 2 data points. Determine and use a key to assist in the analysis of the ...
- 2.PS.1.d
Organize and represent a data set using a bar graph with a title and labeled axes (limited to 25 or fewer data points for up to six categories, and limit increm...
- 2.PS.1.e.i
ask and answer questions about the data represented in pictographs and bar graphs (e.g., total number of data points represented, how many in each category, how...
- 2.PS.1.e.ii
draw conclusions about the data and make predictions based on the data.
Teacher's field guide
What This Cluster Means
What Students Need to Do
- Students ask a survey question, decide what information they need, and collect up to 25 responses. They create and read pictographs and bar graphs, compare categories, find totals, and make supported predictions.
What Mastery Looks Like
- Students collect accurate data and create a graph with a title, labels, and a correct key or scale. They find totals and differences, then support conclusions or predictions with graph data.
Common Misconceptions
- Students may count each pictograph symbol as one instead of using the key. They may skip values on a bar graph scale, omit labels, or compare bar heights without finding the numerical difference.
How to Assess It
- Give students these results: cats 6, dogs 10, fish 4, birds 2. Ask them to create a labeled bar graph with a scale of two, then state how many more students chose dogs than fish.
Lesson moves
Ways to Teach It
Have students vote for one of four read-aloud books with sticky notes, tally votes, then build a bar graph with a scale of two.
Display a pictograph with a key of two, then ask, "Which claim can you prove, and what graph evidence supports it?"
Pair students to draw graph detective cards and earn a point for correctly finding a category total, difference, or supported conclusion.
Record the weather for ten school days, make a pictograph, and use the pattern to predict the next day's category.
Free download
Printable 2.PS.1 Worksheet
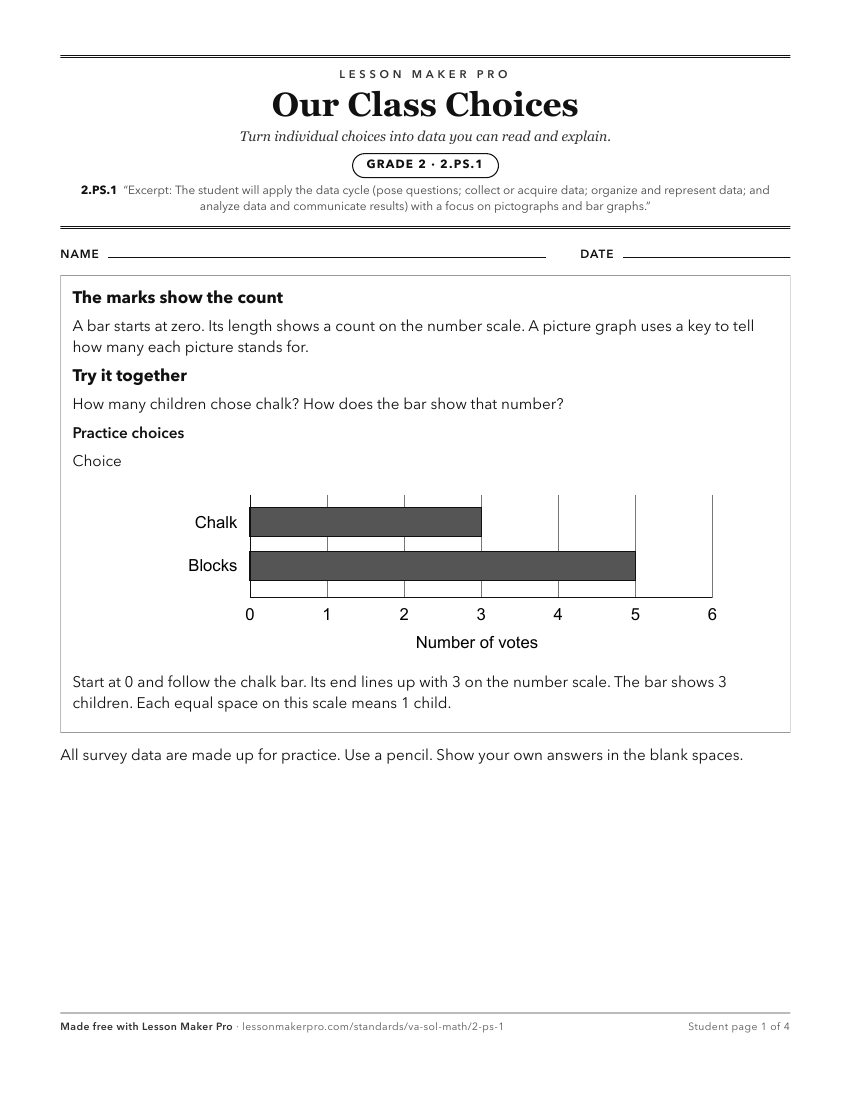
A ready-to-print activity worksheet aligned to 2.PS.1, with an answer key for the teacher on its own page. No account needed.
PDF, US Letter, prints cleanly in black and white.
Download the worksheetKeep exploring
Related Standards
- 1.PS.1
The student will apply the data cycle (pose questions; collect or acquire data; organize and represent data; and analyze data and communicate results) with a fo...
- K.PS.1
The student will apply the data cycle (pose questions; collect or acquire data; organize and represent data; and analyze data and communicate results) with a fo...
- 3.PS.1
The student will apply the data cycle (formulate questions; collect or acquire data; organize and represent data; and analyze data and communicate results) with...
- 6.PS.1
The student will apply the data cycle (formulate questions; collect or acquire data; organize and represent data; and analyze data and communicate results) with...
Turn this cluster into a lesson
Grade, subject, topic, and the complete cluster are prefilled. Create one free, no account needed.
Also for this cluster:Make a WorksheetMake a QuizMake a Sub Lesson