Virginia SOL 3.PS.1
SOL Standard (Knowledge and Skills Cluster)
The student will apply the data cycle (formulate questions; collect or acquire data; organize and represent data; and analyze data and communicate results) with a focus on pictographs and bar graphs.
Virginia Standards of Learning for Mathematics
Cluster contents
Knowledge and Skills in This Standard
3.PS.1 is a Standards of Learning standard. These are the knowledge and skills expectations under it.
- 3.PS.1.a
Formulate questions that require the collection or acquisition of data.
- 3.PS.1.b
Determine the data needed to answer a formulated question and collect or acquire existing data (limited to 30 or fewer data points for no more than eight catego...
- 3.PS.1.c
Organize and represent a data set using pictographs that include an appropriate title, labeled axes, and key. Each pictograph symbol should represent 1, 2, 5 or...
- 3.PS.1.d
Organize and represent a data set using bar graphs with a title and labeled axes, with and without the use of technology tools. Determine and use an appropriate...
- 3.PS.1.e.i
describe the categories of data and the data as a whole (e.g., data were collected on preferred ways to cook or prepare eggs - scrambled, fried, hard boiled, an...
- 3.PS.1.e.ii
identify parts of the data that have special characteristics, including categories with the greatest, the least, or the same (e.g., most students prefer scrambl...
- 3.PS.1.e.iii
make inferences about data represented in pictographs and bar graphs
- 3.PS.1.e.iv
use characteristics of the data to draw conclusions about the data and make predictions based on the data (e.g., it is unlikely that a third grader would like h...
- 3.PS.1.e.v
solve one- and two-step addition and subtraction problems using data from pictographs and bar graphs.
Teacher's field guide
What This Cluster Means
What Students Need to Do
- Students pose a question, decide what data will answer it, and collect up to 30 responses across no more than eight categories. They organize the results in a pictograph or bar graph using clear labels, a key, and an appropriate scale. They compare values, solve problems, and explain conclusions or predictions using the data.
What Mastery Looks Like
- A student can collect a small data set and create an accurate pictograph or bar graph with a title and labels. They choose and use an appropriate key or scale. They compare categories, solve addition and subtraction problems, and support conclusions with data.
Common Misconceptions
- Students may count each pictograph symbol as one item and ignore the key. They may draw bars to incorrect values when the scale skips numbers. They may make predictions that are not supported by the graph.
How to Assess It
- Exit ticket: Give students these totals: books 8, games 6, art 4, sports 2. Have them draw a labeled bar graph with a scale of 2, compare books and art, and make one supported prediction.
Lesson moves
Ways to Teach It
Have pairs poll 20 classmates about four recess choices, record tallies, and build a pictograph with a key.
Display a bar graph of class pet preferences and ask, “What claim can you make, and which bars support it?”
Play Graph Match: students pair data tables with graph cards, then explain any mismatched scale, label, or key.
Use cafeteria lunch totals to make a bar graph and predict how many meals of each type may be needed tomorrow.
Free download
Printable 3.PS.1 Worksheet
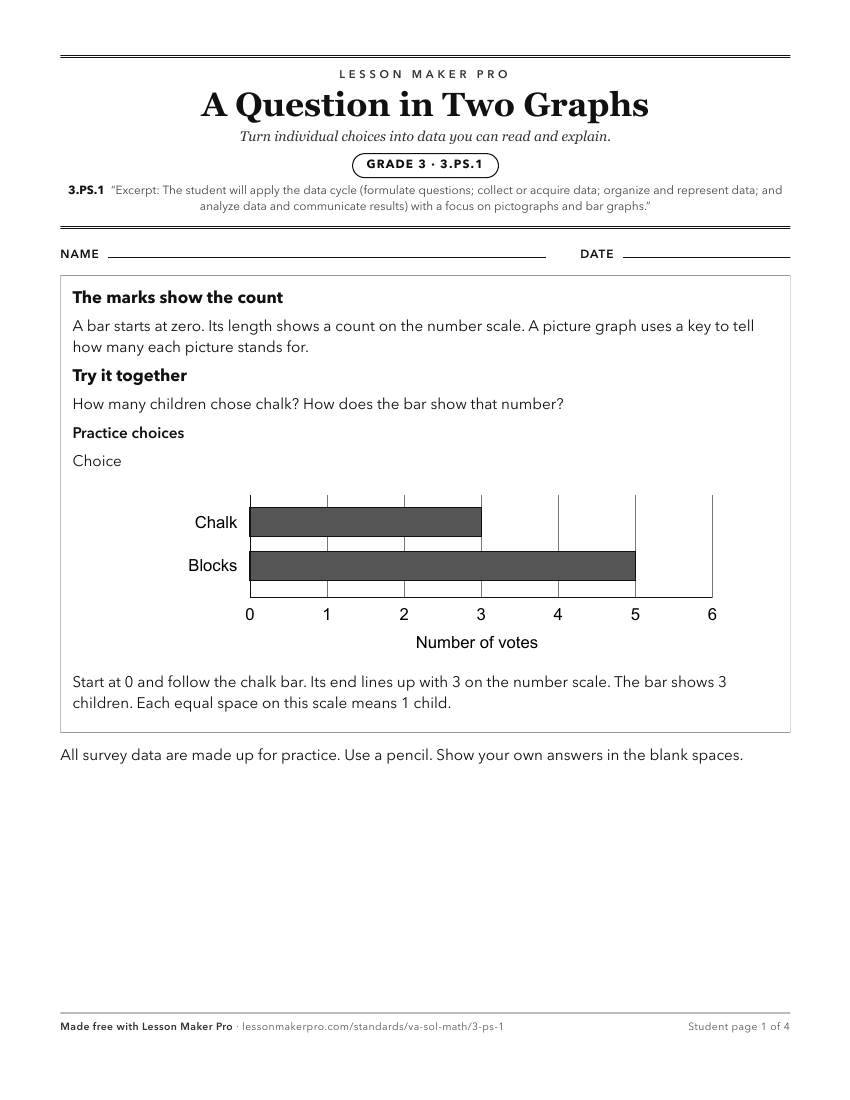
A ready-to-print activity worksheet aligned to 3.PS.1, with an answer key for the teacher on its own page. No account needed.
PDF, US Letter, prints cleanly in black and white.
Download the worksheetKeep exploring
Related Standards
- 4.PS.1
The student will apply the data cycle (formulate questions; collect or acquire data; organize and represent data; and analyze data and communicate results) with...
- 1.PS.1
The student will apply the data cycle (pose questions; collect or acquire data; organize and represent data; and analyze data and communicate results) with a fo...
- K.PS.1
The student will apply the data cycle (pose questions; collect or acquire data; organize and represent data; and analyze data and communicate results) with a fo...
- 2.PS.1
The student will apply the data cycle (pose questions; collect or acquire data; organize and represent data; and analyze data and communicate results) with a fo...
Turn this cluster into a lesson
Grade, subject, topic, and the complete cluster are prefilled. Create one free, no account needed.
Also for this cluster:Make a WorksheetMake a QuizMake a Sub Lesson