Virginia SOL 3.PS.1.e.ii
The Standard
identify parts of the data that have special characteristics, including categories with the greatest, the least, or the same (e.g., most students prefer scrambled eggs)
Virginia Standards of Learning for Mathematics · The student will apply the data cycle (formulate questions; collect or acquire data; organize and represent data; and analyze data and communicate results) with a focus on pictographs and bar graphs.
Teacher's field guide
What This Standard Means
What Students Need to Do
- Students read pictographs and bar graphs to compare category values. They identify which categories have the greatest, least, or equal amounts and explain their findings with graph evidence.
What Mastery Looks Like
- Students correctly name categories with the greatest, least, and equal values. They state or write a clear comparison and support it with numbers from the graph.
Common Misconceptions
- Students may choose the tallest picture instead of using the pictograph key to find its value. They may overlook ties or confuse the greatest category with the category listed first. Some give an answer without citing values from the graph.
How to Assess It
- Show a bar graph with apples 8, bananas 5, oranges 8, and pears 3. Ask students to name the greatest, least, and equal categories, then support each answer with numbers.
Lesson moves
Ways to Teach It
Have students build a class snack-preference graph with linking cubes, then label the greatest, least, and equal categories.
Ask students to write three claims about a graph and cite a number from the graph for each claim.
Play Graph Detective by showing pictographs and awarding points for finding the greatest, least, or tied categories accurately.
Use a cafeteria menu survey, graph the class responses, and write which item should be prepared most and why.
Free download
Printable 3.PS.1.e.ii Worksheet
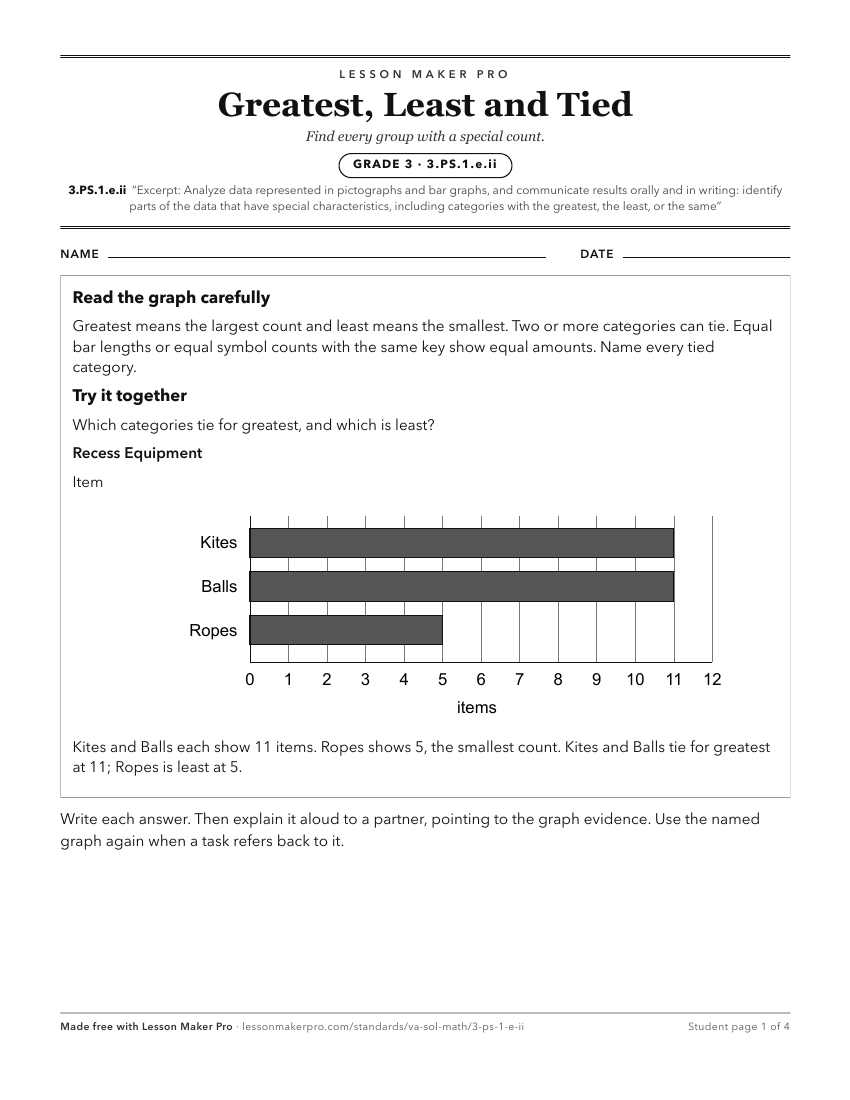
A ready-to-print activity worksheet aligned to 3.PS.1.e.ii, with an answer key for the teacher on its own page. No account needed.
PDF, US Letter, prints cleanly in black and white.
Download the worksheetKeep exploring
Related Standards
- 3.PS.1.e.i
describe the categories of data and the data as a whole (e.g., data were collected on preferred ways to cook or prepare eggs - scrambled, fried, hard boiled, an...
- 5.PS.1.e.iii
identify parts of the data that have special characteristics and explain the meaning of the greatest, the least, or the same (e.g., the stem-and-leaf plot shows...
- 4.PS.1.d.ii
identify parts of the data that have special characteristics and explain the meaning of the greatest, the least, or the same (e.g., the highest temperature show...
- 3.PS.1.e.iv
use characteristics of the data to draw conclusions about the data and make predictions based on the data (e.g., it is unlikely that a third grader would like h...
Turn this exact standard into a lesson
Grade, subject, topic, and the complete standard are prefilled. Create one free, no account needed.
Also for this standard:Make a WorksheetMake a QuizMake a Sub Lesson