Virginia SOL 4.PS.1.d.ii
The Standard
identify parts of the data that have special characteristics and explain the meaning of the greatest, the least, or the same (e.g., the highest temperature shows the warmest day)
Virginia Standards of Learning for Mathematics · The student will apply the data cycle (formulate questions; collect or acquire data; organize and represent data; and analyze data and communicate results) with a focus on line graphs.
Teacher's field guide
What This Standard Means
What Students Need to Do
- Students locate the highest, lowest, equal, and other noticeable values on a line graph. They explain what those points mean in the situation, using labels, units, and evidence from the graph.
What Mastery Looks Like
- A student correctly identifies notable points and distinguishes the greatest value from the steepest change. The student explains each finding with labels, units, and graph evidence, both orally and in writing.
Common Misconceptions
- Students may name the highest or lowest point without explaining what it means in context. They may confuse the steepest segment with the greatest value, or overlook equal values shown on different days.
How to Assess It
- Display a line graph of daily temperatures with one highest point and two equal points. Ask students to identify those points and explain what each means.
Lesson moves
Ways to Teach It
Give pairs a printed line graph and sticky notes to label the highest, lowest, equal, and sharply changing values.
Students choose one notable point and write two sentences explaining what happened and which graph value supports their claim.
Play Graph Detective, where teams earn points for correctly finding and interpreting a greatest, least, equal, or unusual value.
Track the classroom temperature for a week, graph it, then explain which day was warmest, coolest, or matched another day.
Free download
Printable 4.PS.1.d.ii Worksheet
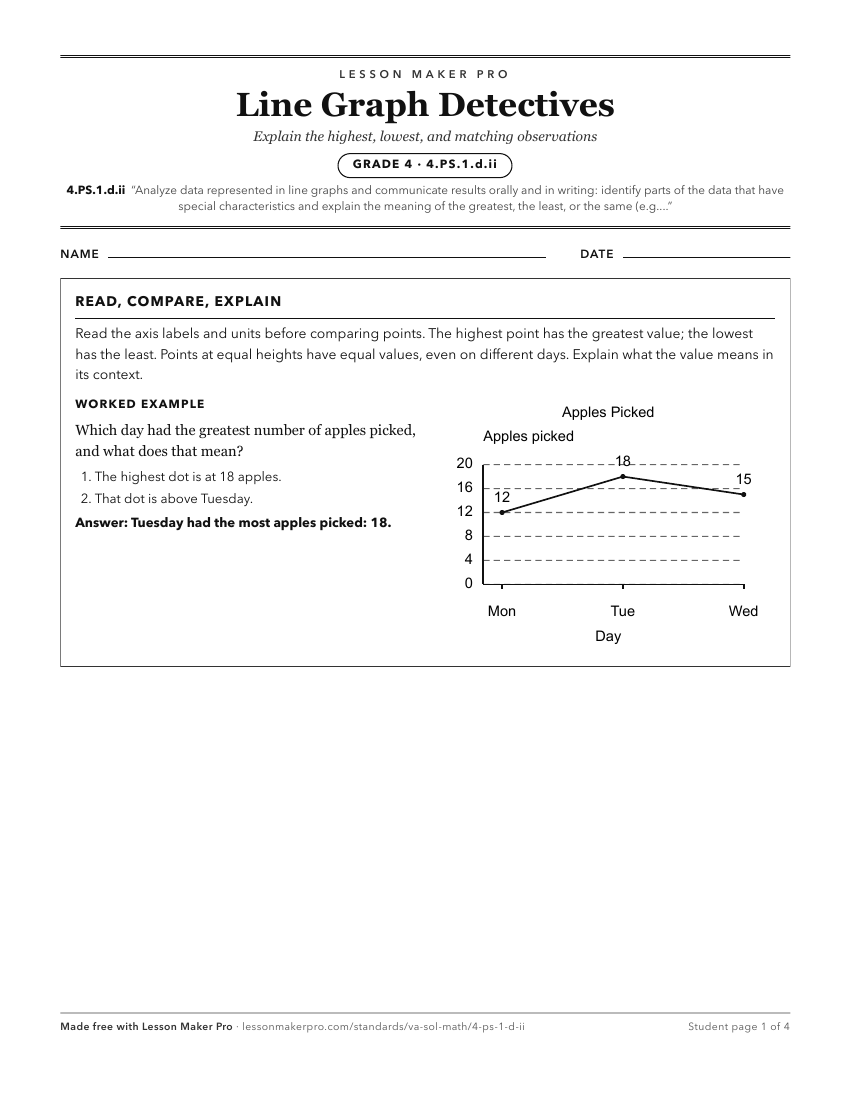
A ready-to-print activity worksheet aligned to 4.PS.1.d.ii, with an answer key for the teacher on its own page. No account needed.
PDF, US Letter, prints cleanly in black and white.
Download the worksheetKeep exploring
Related Standards
- K.PS.1.g.i
ask and answer questions about the data represented in object graphs and picture graphs (e.g., how many in each category, which categories have the greatest, le...
- 5.PS.1.e.iii
identify parts of the data that have special characteristics and explain the meaning of the greatest, the least, or the same (e.g., the stem-and-leaf plot shows...
- 3.PS.1.e.ii
identify parts of the data that have special characteristics, including categories with the greatest, the least, or the same (e.g., most students prefer scrambl...
- 4.PS.1.d.i
describe the characteristics of the data represented in a line graph and the data as a whole (e.g., the time period when the temperature increased the most)
Turn this exact standard into a lesson
Grade, subject, topic, and the complete standard are prefilled. Create one free, no account needed.
Also for this standard:Make a WorksheetMake a QuizMake a Sub Lesson