Virginia SOL 5.PS.1.e.iii
The Standard
identify parts of the data that have special characteristics and explain the meaning of the greatest, the least, or the same (e.g., the stem-and-leaf plot shows that the same number of students scored in the 90s as scored in the 70s)
Virginia Standards of Learning for Mathematics · The student will apply the data cycle (formulate questions; collect or acquire data; organize and represent data; and analyze data and communicate results) with a focus on line plots (dot plots) and stem-and-leaf plots.
Teacher's field guide
What This Standard Means
What Students Need to Do
- Students read dot plots and stem-and-leaf plots, then compare how often values or ranges occur. They identify notable features and explain their findings aloud and in writing using the data as evidence.
What Mastery Looks Like
- Students accurately count dots or leaves and compare frequencies. They identify repeated values, gaps, clusters, and ranges with greatest, least, or equal counts. Their conclusions name evidence from the plot.
Common Misconceptions
- Students may report the highest value when asked which value or range has the greatest count. They may count stems instead of leaves, ignore the key, or miss equal frequencies in different ranges.
How to Assess It
- Show this dot plot: 8: •••, 9: •, 10: •••, 11: ••. Ask students to identify the greatest, least, and equal frequencies and explain each answer in context.
Lesson moves
Ways to Teach It
Build a floor dot plot with sticky notes showing classmates’ shoe sizes, then label the most, least, and equally common sizes.
Show a stem-and-leaf plot and ask, “Which score ranges have equal counts, and what does that tell us about the class?”
Play Plot Detective: pairs draw claim cards, find matching evidence in a plot, and correct claims that confuse values with frequencies.
Use one month of daily temperatures to make a stem-and-leaf plot, then write two sentences comparing counts across temperature ranges.
Free download
Printable 5.PS.1.e.iii Worksheet
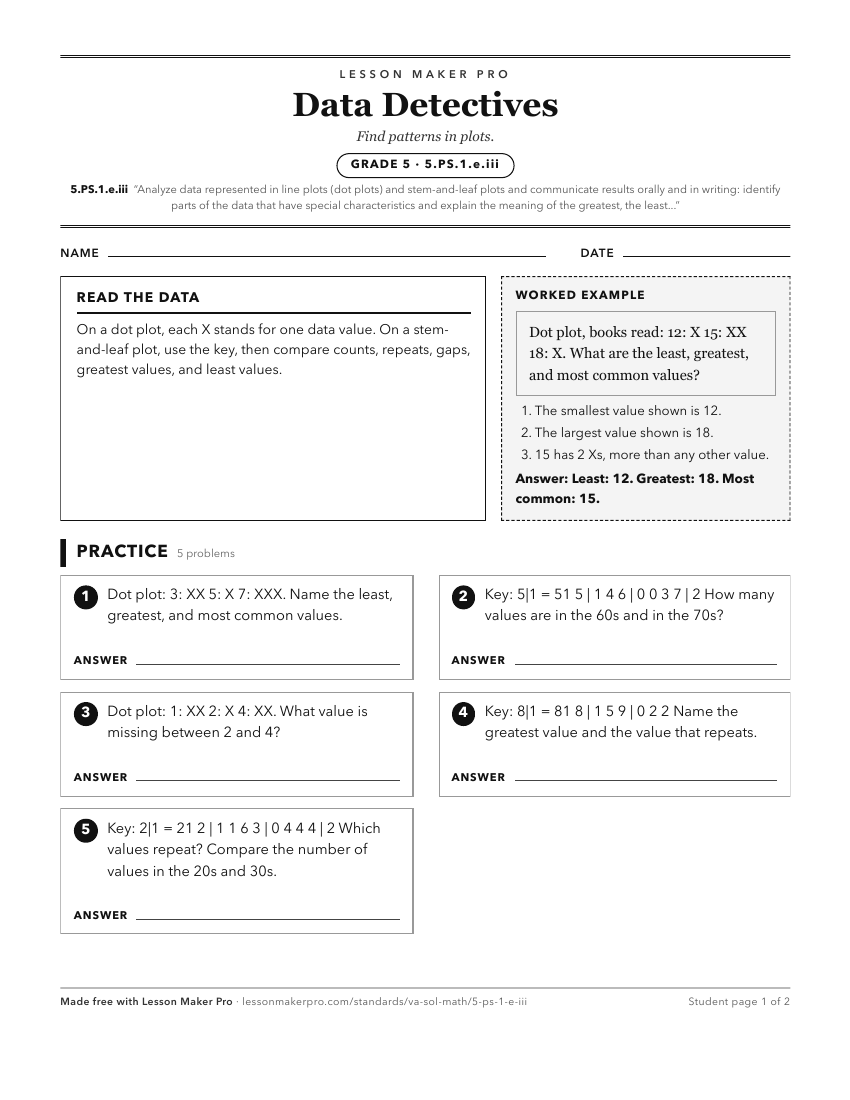
A ready-to-print activity worksheet aligned to 5.PS.1.e.iii, with an answer key for the teacher on its own page. No account needed.
PDF, US Letter, prints cleanly in black and white.
Download the worksheetKeep exploring
Related Standards
- 5.PS.1.d
Organize and represent numerical data using a stem-and-leaf plot with a title and key, where the stems are listed in ascending order and the leaves are in ascen...
- 3.PS.1.e.ii
identify parts of the data that have special characteristics, including categories with the greatest, the least, or the same (e.g., most students prefer scrambl...
- 4.PS.1.d.ii
identify parts of the data that have special characteristics and explain the meaning of the greatest, the least, or the same (e.g., the highest temperature show...
- 5.PS.1.e.i
describe the characteristics of the data represented in a line plot (dot plot) and stem-andleaf plot as a whole (e.g., the shape and spread of the data)
Turn this exact standard into a lesson
Grade, subject, topic, and the complete standard are prefilled. Create one free, no account needed.
Also for this standard:Make a WorksheetMake a QuizMake a Sub Lesson