Virginia SOL 5.PS.1.d
The Standard
Organize and represent numerical data using a stem-and-leaf plot with a title and key, where the stems are listed in ascending order and the leaves are in ascending order, with or without commas between the leaves.
Virginia Standards of Learning for Mathematics · The student will apply the data cycle (formulate questions; collect or acquire data; organize and represent data; and analyze data and communicate results) with a focus on line plots (dot plots) and stem-and-leaf plots.
Teacher's field guide
What This Standard Means
What Students Need to Do
- Students sort a set of numerical data and split each number by place value into a stem and a leaf. They arrange the entries from least to greatest and include a title and key.
What Mastery Looks Like
- A student can turn an unsorted data set into an accurate plot with every value included, including repeats. The student orders all entries correctly and adds a clear title and matching key.
Common Misconceptions
- Students may reverse the stem and leaf or split numbers at the wrong place value. They may omit repeated values, leave entries unsorted, or write a key that does not match the data.
How to Assess It
- Give students the data set 24, 31, 27, 22, 31, 35, 29, 24. Ask them to create a complete stem-and-leaf plot and explain what 2 | 7 represents.
Lesson moves
Ways to Teach It
Give pairs 20 number cards to sort and arrange into a stem-and-leaf plot on chart paper with a title and key.
Have students respond to the prompt, “Explain what 4 | 7 means and why the key matters,” then compare answers with a partner.
Play Plot Repair, where teams find and fix scrambled stems, missing repeats, incorrect keys, and unordered leaves in five sample plots.
Use one month of daily high temperatures and have students create a plot showing the distribution of temperatures.
Free download
Printable 5.PS.1.d Worksheet
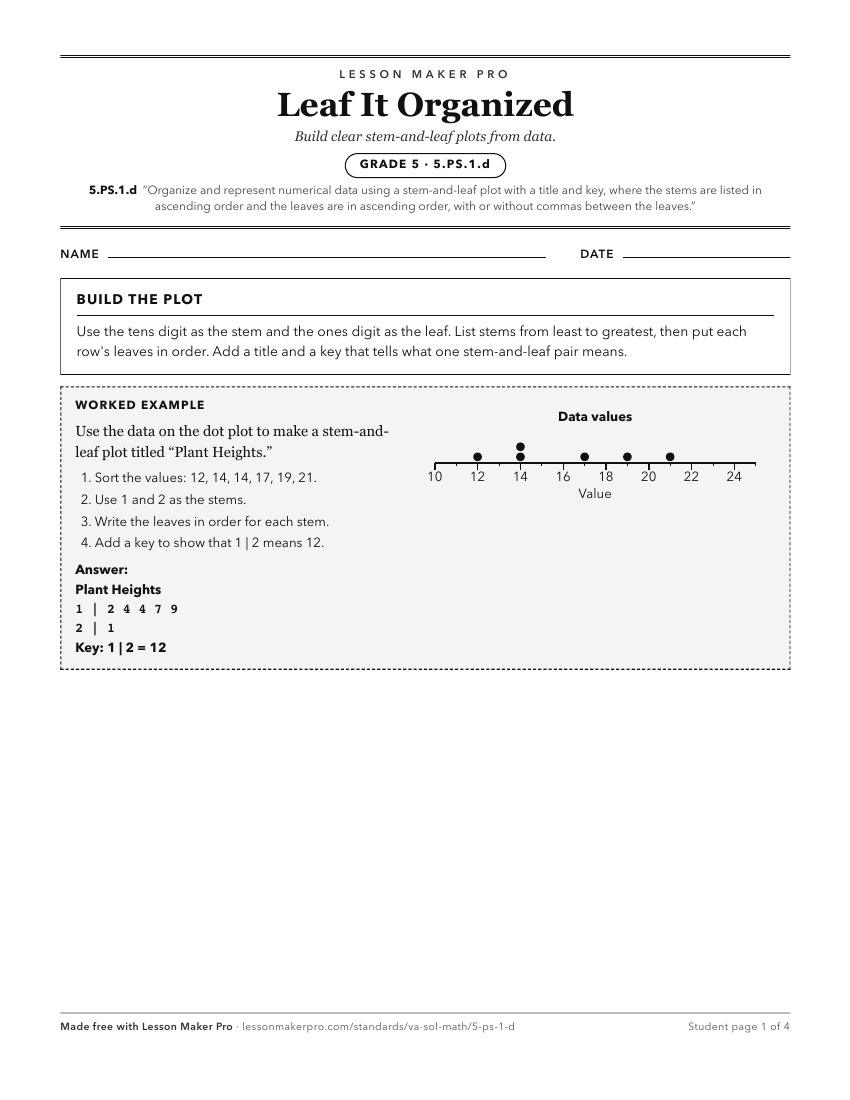
A ready-to-print activity worksheet aligned to 5.PS.1.d, with an answer key for the teacher on its own page. No account needed.
PDF, US Letter, prints cleanly in black and white.
Download the worksheetKeep exploring
Related Standards
- 4.PS.1.c
Organize and represent a data set using line graphs with a title and labeled axes with whole number increments, with and without the use of technology tools.
- 5.PS.1.e.iii
identify parts of the data that have special characteristics and explain the meaning of the greatest, the least, or the same (e.g., the stem-and-leaf plot shows...
- 5.PS.1.c
Organize and represent a data set using a line plot (dot plot) with a title, labeled axes, and a key, with and without the use of technology tools. Lines plots ...
- 8.PS.2.d
Organize and represent a numeric data set of no more than 20 items, using boxplots, with and without the use of technology.
Turn this exact standard into a lesson
Grade, subject, topic, and the complete standard are prefilled. Create one free, no account needed.
Also for this standard:Make a WorksheetMake a QuizMake a Sub Lesson