Virginia SOL 4.PS.1.c
The Standard
Organize and represent a data set using line graphs with a title and labeled axes with whole number increments, with and without the use of technology tools.
Virginia Standards of Learning for Mathematics · The student will apply the data cycle (formulate questions; collect or acquire data; organize and represent data; and analyze data and communicate results) with a focus on line graphs.
Teacher's field guide
What This Standard Means
What Students Need to Do
- Students arrange paired data in a useful order, choose equal whole-number increments, and plot the points on a line graph. They connect points in order and add a clear title and labels for both axes.
What Mastery Looks Like
- Given a data table, students choose a sensible scale, plot each ordered pair accurately, and connect points in order. They include a clear title and label both axes when working on paper or with a digital tool.
Common Misconceptions
- Students may use uneven spacing between numbers or treat each grid line as a different amount. They may leave off the title or axis labels, swap the axes, or connect points out of order.
How to Assess It
- Exit ticket: Graph Day 1, 2; Day 2, 5; Day 3, 4; Day 4, 7. Include a title, labeled axes, equal whole-number increments, plotted points, and connecting segments.
Lesson moves
Ways to Teach It
Measure classroom temperature each hour, then plot and connect the values on grid paper with a title and labeled axes.
Compare two graphs of the same data and write which is clearer, citing the title, labels, scale, and connected points.
Play Graph Repair: teams fix cards showing missing titles, swapped axes, uneven increments, or points connected out of order.
Enter one week of daily high temperatures in a spreadsheet, create a line graph, and check every required feature.
Free download
Printable 4.PS.1.c Worksheet
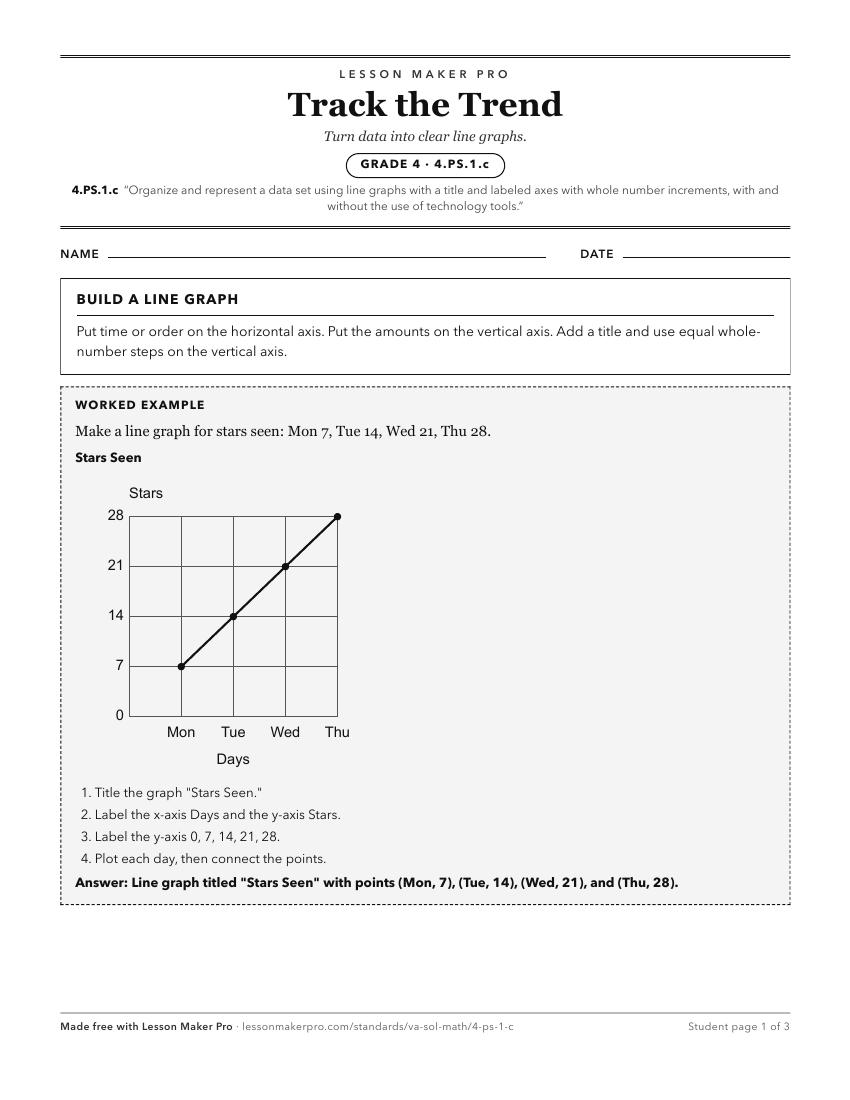
A ready-to-print activity worksheet aligned to 4.PS.1.c, with an answer key for the teacher on its own page. No account needed.
PDF, US Letter, prints cleanly in black and white.
Download the worksheetKeep exploring
Related Standards
- 2.PS.1.d
Organize and represent a data set using a bar graph with a title and labeled axes (limited to 25 or fewer data points for up to six categories, and limit increm...
- 3.PS.1.d
Organize and represent a data set using bar graphs with a title and labeled axes, with and without the use of technology tools. Determine and use an appropriate...
- 5.PS.1.c
Organize and represent a data set using a line plot (dot plot) with a title, labeled axes, and a key, with and without the use of technology tools. Lines plots ...
- 7.PS.2.d
Organize and represent numerical data using histograms with and without the use of technology
Turn this exact standard into a lesson
Grade, subject, topic, and the complete standard are prefilled. Create one free, no account needed.
Also for this standard:Make a WorksheetMake a QuizMake a Sub Lesson