Virginia SOL 5.PS.1.c
The Standard
Organize and represent a data set using a line plot (dot plot) with a title, labeled axes, and a key, with and without the use of technology tools. Lines plots (dot plots) may contain whole numbers, fractions, or decimals.
Virginia Standards of Learning for Mathematics · The student will apply the data cycle (formulate questions; collect or acquire data; organize and represent data; and analyze data and communicate results) with a focus on line plots (dot plots) and stem-and-leaf plots.
Teacher's field guide
What This Standard Means
What Students Need to Do
- Students organize numerical data and display each value with a dot above a number line. They select an equal scale and add a title, labels, and a key by hand and with a digital tool.
What Mastery Looks Like
- A student places one dot for every data value and stacks repeated values correctly. The plot uses equal intervals and includes a clear title, axis label, and key.
Common Misconceptions
- Students may connect the dots as if making a line graph. They may show each value only once instead of stacking dots for repeated values. Unequal scale intervals, misplaced fractions or decimals, and missing labels or keys are also common.
How to Assess It
- Give students the data set 1, 1.5, 1.5, 2, 2, 2.5. Ask them to create a dot plot with a title, labeled axis, and key.
Lesson moves
Ways to Teach It
Have students measure ten classroom objects to the nearest half inch, then build a paper dot plot using sticky notes.
Display a dot plot and ask students to write how its title, labels, scale, and key help a reader understand the data.
Give pairs data cards and graph paper, then award one point for each accurate dot plot completed in three minutes.
Record daily temperatures for one week, then create a digital dot plot and explain which temperature occurred most often.
Free download
Printable 5.PS.1.c Worksheet
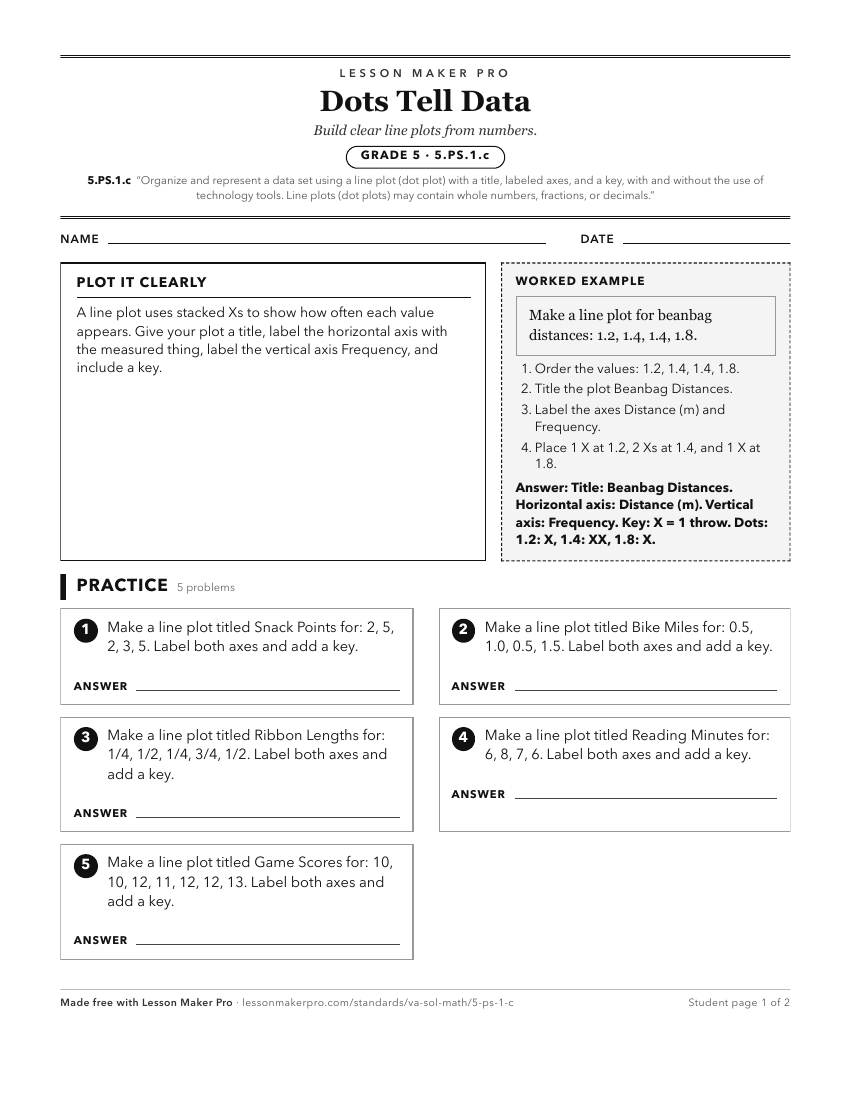
A ready-to-print activity worksheet aligned to 5.PS.1.c, with an answer key for the teacher on its own page. No account needed.
PDF, US Letter, prints cleanly in black and white.
Download the worksheetKeep exploring
Related Standards
- 4.PS.1.c
Organize and represent a data set using line graphs with a title and labeled axes with whole number increments, with and without the use of technology tools.
- 3.PS.1.d
Organize and represent a data set using bar graphs with a title and labeled axes, with and without the use of technology tools. Determine and use an appropriate...
- 3.PS.1.c
Organize and represent a data set using pictographs that include an appropriate title, labeled axes, and key. Each pictograph symbol should represent 1, 2, 5 or...
- 5.PS.1.e.i
describe the characteristics of the data represented in a line plot (dot plot) and stem-andleaf plot as a whole (e.g., the shape and spread of the data)
Turn this exact standard into a lesson
Grade, subject, topic, and the complete standard are prefilled. Create one free, no account needed.
Also for this standard:Make a WorksheetMake a QuizMake a Sub Lesson