Virginia SOL 3.PS.1.e.i
The Standard
describe the categories of data and the data as a whole (e.g., data were collected on preferred ways to cook or prepare eggs - scrambled, fried, hard boiled, and egg salad)
Virginia Standards of Learning for Mathematics · The student will apply the data cycle (formulate questions; collect or acquire data; organize and represent data; and analyze data and communicate results) with a focus on pictographs and bar graphs.
Teacher's field guide
What This Standard Means
What Students Need to Do
- Students read pictographs and bar graphs and identify what each category represents. They describe what the full data set is about and communicate that description aloud and in writing.
What Mastery Looks Like
- Students correctly name each category shown on a pictograph or bar graph. They explain the graph’s overall subject and summarize the data clearly in speech or writing.
Common Misconceptions
- Students may name the numbers instead of the categories. They may describe only the tallest bar, ignore the pictograph key, or give details without stating what the whole graph shows.
How to Assess It
- Show a four-category bar graph of favorite recess activities. Ask, “Name every category, then write one sentence explaining what the graph as a whole shows.”
Lesson moves
Ways to Teach It
Give pairs a pictograph, category cards, and a title card to match, then have them explain how each part describes the data.
Display a bar graph and ask, “What are the categories, and what does the whole graph tell us?” Students answer orally, then write.
Play Graph Reporter: students draw a graph card and earn points by naming every category and giving an accurate overall description.
Survey classmates about lunch choices, make a class bar graph, and write a morning announcement describing its categories and overall results.
Free download
Printable 3.PS.1.e.i Worksheet
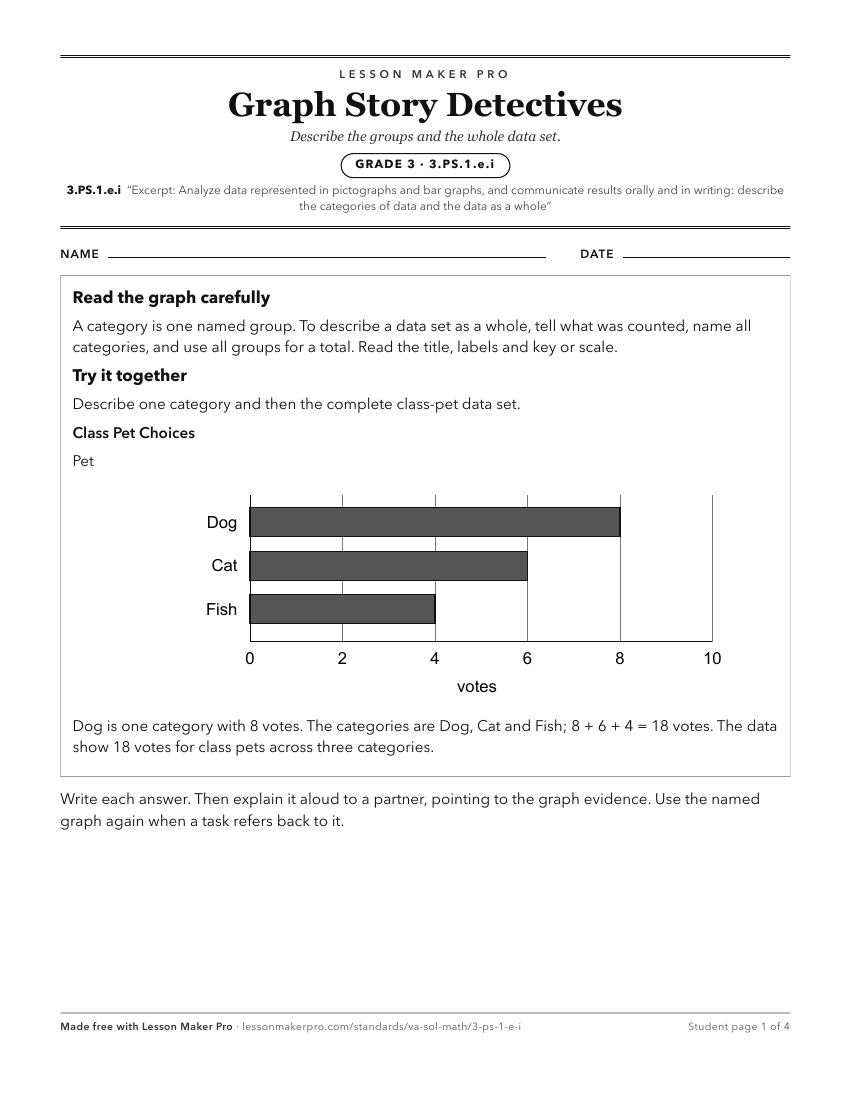
A ready-to-print activity worksheet aligned to 3.PS.1.e.i, with an answer key for the teacher on its own page. No account needed.
PDF, US Letter, prints cleanly in black and white.
Download the worksheetKeep exploring
Related Standards
- 1.PS.1.g.i
ask and answer questions about the data represented in object graphs, picture graphs, and tables (e.g., total number of data points represented, how many in eac...
- 3.PS.1.e.ii
identify parts of the data that have special characteristics, including categories with the greatest, the least, or the same (e.g., most students prefer scrambl...
- 4.PS.1.d.ii
identify parts of the data that have special characteristics and explain the meaning of the greatest, the least, or the same (e.g., the highest temperature show...
- 3.PS.1.e.iv
use characteristics of the data to draw conclusions about the data and make predictions based on the data (e.g., it is unlikely that a third grader would like h...
Turn this exact standard into a lesson
Grade, subject, topic, and the complete standard are prefilled. Create one free, no account needed.
Also for this standard:Make a WorksheetMake a QuizMake a Sub Lesson