Virginia SOL 3.PS.1.e.iii
The Standard
make inferences about data represented in pictographs and bar graphs
Virginia Standards of Learning for Mathematics · The student will apply the data cycle (formulate questions; collect or acquire data; organize and represent data; and analyze data and communicate results) with a focus on pictographs and bar graphs.
Teacher's field guide
What This Standard Means
What Students Need to Do
- Students study pictographs and bar graphs for patterns, differences, and likely conclusions. They state an inference and point to data from the graph that supports it.
What Mastery Looks Like
- A student makes a reasonable claim based on patterns, differences, or totals in a graph. The student supports the claim with accurate graph evidence and explains it clearly in speech or writing.
Common Misconceptions
- Students may treat an inference as a fact directly shown on the graph. They may ignore the pictograph key or misread the scale on a bar graph. Some invent causes, such as why one choice is popular, without evidence.
How to Assess It
- Show a bar graph with 8 votes for dogs, 5 for cats, and 2 for fish. Ask students to write one reasonable inference and support it with graph evidence.
Lesson moves
Ways to Teach It
Survey classmates about recess choices, build a sticky-note bar graph, then write one reasonable inference supported by two bar heights.
Display a pictograph and ask, “What might be true, and which graph details support your thinking?”
Play Evidence Match by pairing inference cards with graphs, rejecting any card that the data does not support.
Graph cafeteria fruit choices from a class tally, then write a recommendation for which fruit the cafeteria should stock most.
Free download
Printable 3.PS.1.e.iii Worksheet
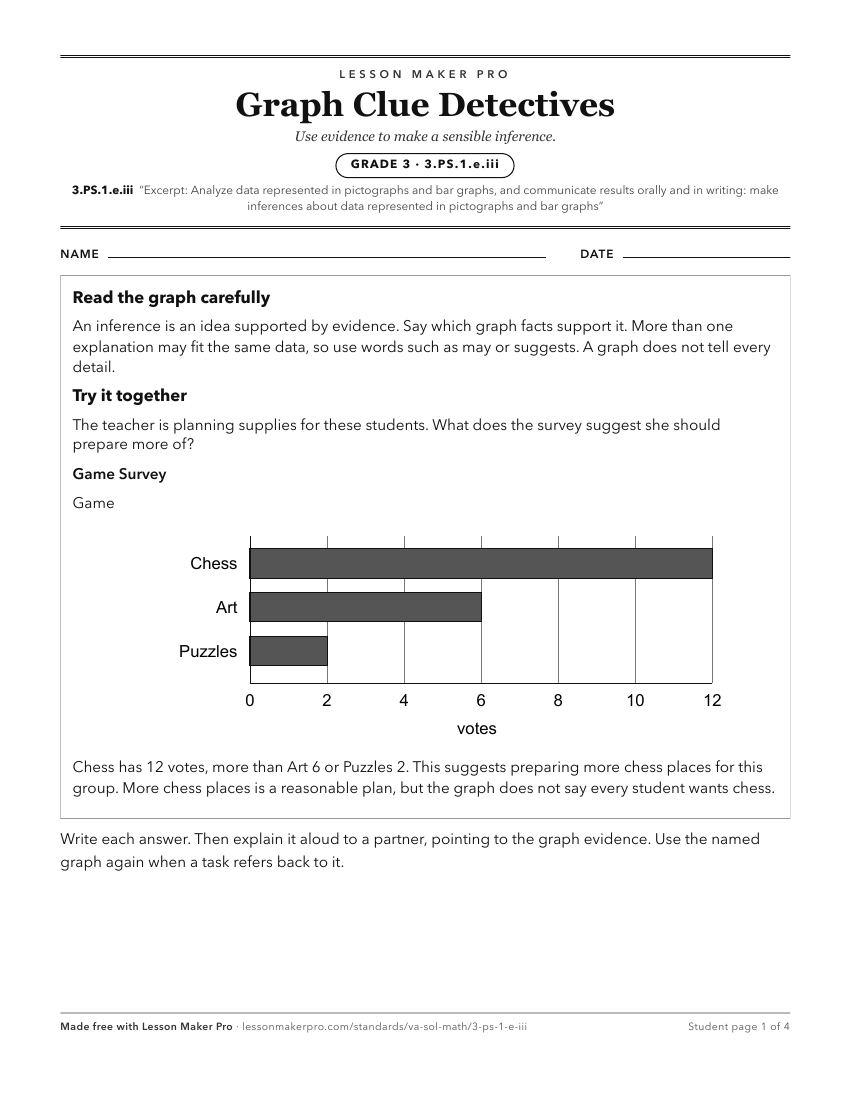
A ready-to-print activity worksheet aligned to 3.PS.1.e.iii, with an answer key for the teacher on its own page. No account needed.
PDF, US Letter, prints cleanly in black and white.
Download the worksheetKeep exploring
Related Standards
- 2.PS.1.e.i
ask and answer questions about the data represented in pictographs and bar graphs (e.g., total number of data points represented, how many in each category, how...
- 4.PS.1.d.iii
make inferences about data represented in line graphs
- 3.PS.1.e.v
solve one- and two-step addition and subtraction problems using data from pictographs and bar graphs.
- 2.PS.1
The student will apply the data cycle (pose questions; collect or acquire data; organize and represent data; and analyze data and communicate results) with a fo...
Turn this exact standard into a lesson
Grade, subject, topic, and the complete standard are prefilled. Create one free, no account needed.
Also for this standard:Make a WorksheetMake a QuizMake a Sub Lesson