Virginia SOL 4.PS.1
SOL Standard (Knowledge and Skills Cluster)
The student will apply the data cycle (formulate questions; collect or acquire data; organize and represent data; and analyze data and communicate results) with a focus on line graphs.
Virginia Standards of Learning for Mathematics
Cluster contents
Knowledge and Skills in This Standard
4.PS.1 is a Standards of Learning standard. These are the knowledge and skills expectations under it.
- 4.PS.1.a
Formulate questions that require the collection or acquisition of data.
- 4.PS.1.b
Determine the data needed to answer a formulated question and collect or acquire existing data (limited to 10 or fewer data points) using various methods (e.g.,...
- 4.PS.1.c
Organize and represent a data set using line graphs with a title and labeled axes with whole number increments, with and without the use of technology tools.
- 4.PS.1.d.i
describe the characteristics of the data represented in a line graph and the data as a whole (e.g., the time period when the temperature increased the most)
- 4.PS.1.d.ii
identify parts of the data that have special characteristics and explain the meaning of the greatest, the least, or the same (e.g., the highest temperature show...
- 4.PS.1.d.iii
make inferences about data represented in line graphs
- 4.PS.1.d.iv
draw conclusions about the data and make predictions based on the data to answer questions
- 4.PS.1.d.v
solve single-step and multistep addition and subtraction problems using data from line graphs.
Teacher's field guide
What This Cluster Means
What Students Need to Do
- Students ask a question that can be answered with data, then collect or find up to 10 ordered data points. They organize the data in a line graph with a title, labeled axes, and even whole-number intervals. They interpret changes, make supported predictions, and solve addition and subtraction problems from the graph.
What Mastery Looks Like
- A student creates an accurate line graph with a clear title, labeled axes, even whole-number intervals, and correctly plotted points. The student describes changes, compares values, supports a prediction, and solves addition or subtraction problems using the graph.
Common Misconceptions
- Students may treat a line graph like a bar graph and connect categories that have no meaningful order. They may use uneven axis intervals, omit labels, confuse highest value with greatest increase, or make predictions without using the data.
How to Assess It
- Give students this data: Monday 62, Tuesday 64, Wednesday 63, Thursday 68, Friday 70. Ask them to graph it, identify the greatest rise, find the Monday-to-Friday change, and predict Saturday's value with evidence.
Lesson moves
Ways to Teach It
Measure a cup of warm water every two minutes for ten minutes, then plot the temperatures and describe the change.
Show a daily temperature line graph and ask students to write when the greatest rise occurred and cite two plotted values.
Give pairs data cards to graph, then have partners trade graphs and answer comparison, change, and prediction questions.
Use ten days of local weather data to make a line graph and predict the next day's temperature from the pattern.
Free download
Printable 4.PS.1 Worksheet
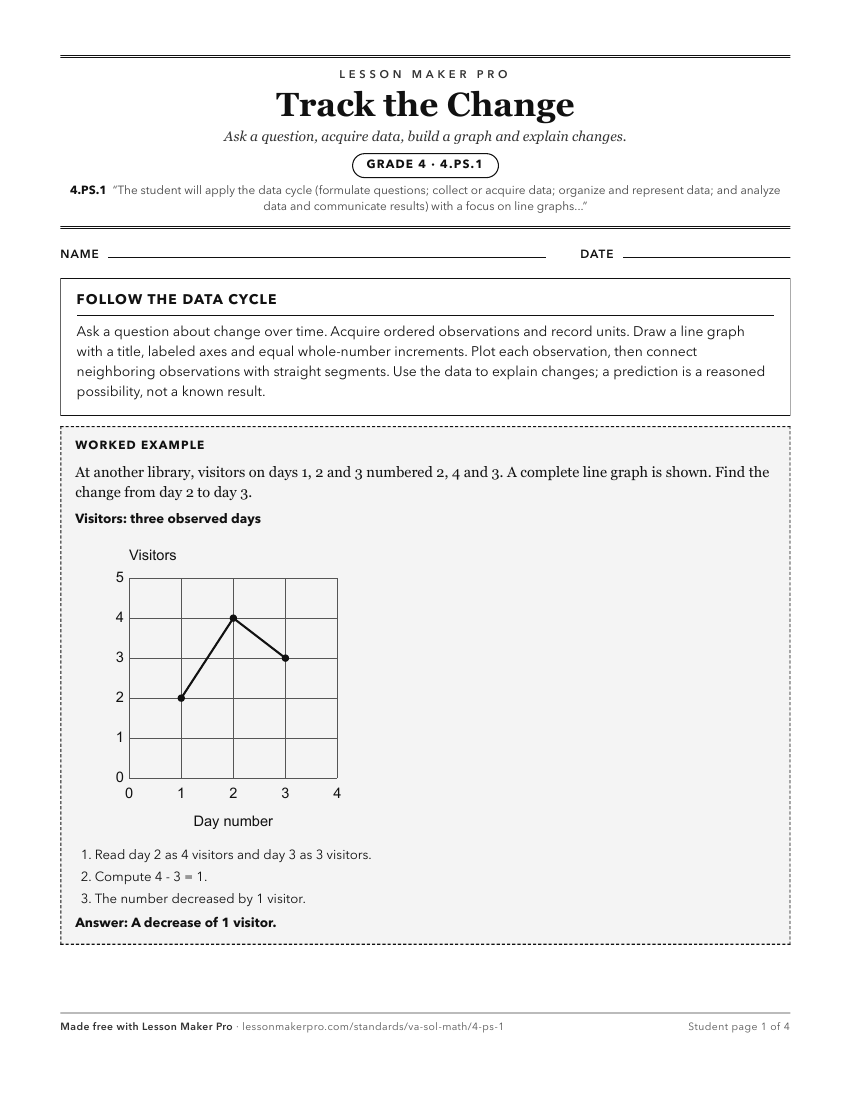
A ready-to-print activity worksheet aligned to 4.PS.1, with an answer key for the teacher on its own page. No account needed.
PDF, US Letter, prints cleanly in black and white.
Download the worksheetKeep exploring
Related Standards
- 8.PS.2
The student will apply the data cycle (formulate questions; collect or acquire data; organize and represent data; and analyze data and communicate results) with...
- 1.PS.1
The student will apply the data cycle (pose questions; collect or acquire data; organize and represent data; and analyze data and communicate results) with a fo...
- 7.PS.2
The student will apply the data cycle (formulate questions; collect or acquire data; organize and represent data; and analyze data and communicate results) with...
- 6.PS.1
The student will apply the data cycle (formulate questions; collect or acquire data; organize and represent data; and analyze data and communicate results) with...
Turn this cluster into a lesson
Grade, subject, topic, and the complete cluster are prefilled. Create one free, no account needed.
Also for this cluster:Make a WorksheetMake a QuizMake a Sub Lesson