Virginia SOL 7.PS.2
SOL Standard (Knowledge and Skills Cluster)
The student will apply the data cycle (formulate questions; collect or acquire data; organize and represent data; and analyze data and communicate results) with a focus on histograms.
Virginia Standards of Learning for Mathematics
Cluster contents
Knowledge and Skills in This Standard
7.PS.2 is a Standards of Learning standard. These are the knowledge and skills expectations under it.
- 7.PS.2.a
Formulate questions that require the collection or acquisition of data with a focus on histograms.
- 7.PS.2.b
Determine the data needed to answer a formulated question and collect the data (or acquire existing data) using various methods (e.g., observations, measurement...
- 7.PS.2.c
Determine how sample size and randomness will ensure that the data collected is a sample that is representative of a larger population.
- 7.PS.2.d
Organize and represent numerical data using histograms with and without the use of technology
- 7.PS.2.e
Investigate and explain how using different intervals could impact the representation of the data in a histogram.
- 7.PS.2.f
Compare data represented in histograms with the same data represented in other graphs, including but not limited to line plots (dot plots), circle graphs, and s...
- 7.PS.2.g
Analyze data represented in histograms by making observations and drawing conclusions. Determine how histograms reveal patterns in data that cannot be easily se...
Teacher's field guide
What This Cluster Means
What Students Need to Do
- Students ask a question that can be answered with numerical data, then plan how to collect or find a representative sample. They make histograms, test different interval widths, compare graph types, and use visible patterns to support conclusions.
What Mastery Looks Like
- Students collect suitable numerical data from a reasonably sized, randomly selected sample. They create an accurate histogram with labeled intervals and frequencies. They explain patterns, test different interval widths, and justify whether another graph would show the data better.
Common Misconceptions
- Students may leave gaps between histogram bars or treat each bar as one exact value. They may think changing interval widths changes the data rather than its appearance. They may also assume any convenient sample represents the whole population.
How to Assess It
- Give students 20 numerical values and ask them to make a histogram, describe one pattern, and explain how wider intervals would change its appearance. Ask whether the data came from a representative sample and why.
Lesson moves
Ways to Teach It
Measure classmates’ hand spans, record a random sample, and build a sticky-note histogram using equal-width intervals.
Show two histograms of the same data and ask, “How do the intervals change the story the graph tells?”
Give teams graph cards showing one data set as a histogram, dot plot, circle graph, and stem-and-leaf plot to rank and justify.
Use local daily temperatures to create a histogram, identify clusters and extremes, and explain what the pattern suggests about the month.
Free download
Printable 7.PS.2 Worksheet
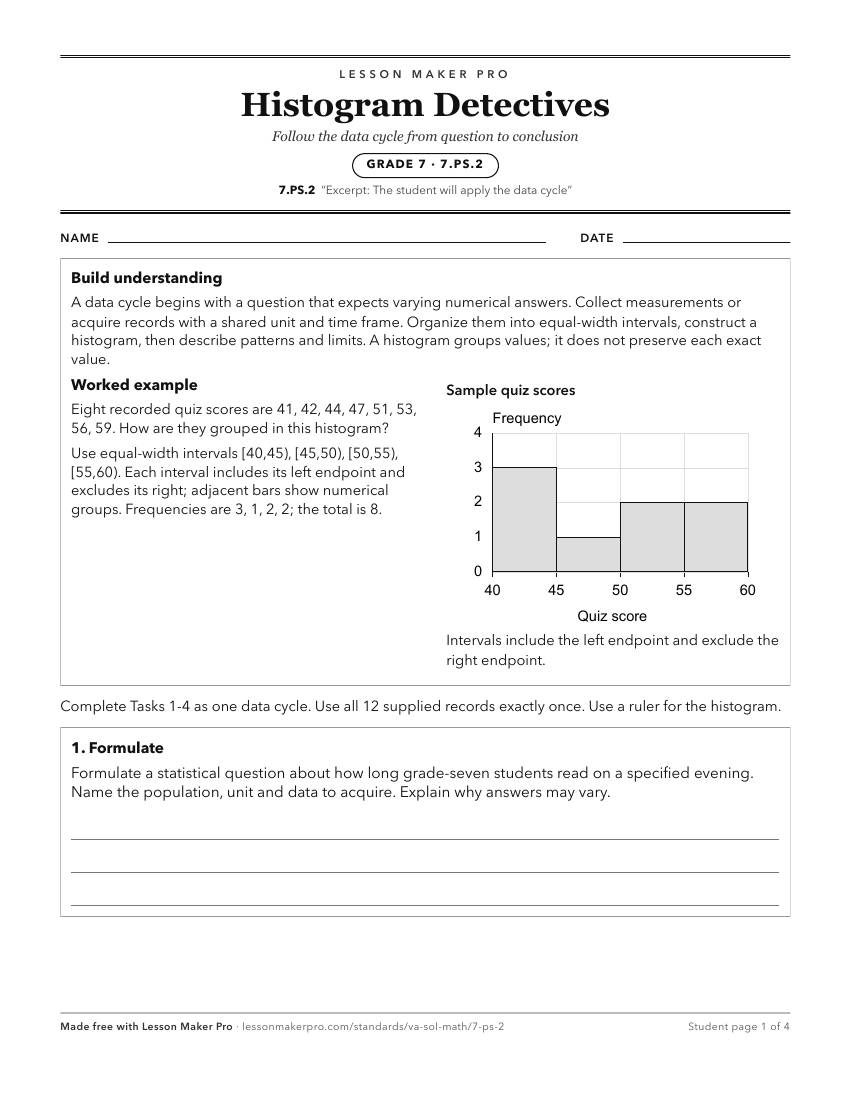
A ready-to-print activity worksheet aligned to 7.PS.2, with an answer key for the teacher on its own page. No account needed.
PDF, US Letter, prints cleanly in black and white.
Download the worksheetKeep exploring
Related Standards
- 4.PS.1
The student will apply the data cycle (formulate questions; collect or acquire data; organize and represent data; and analyze data and communicate results) with...
- 8.PS.2
The student will apply the data cycle (formulate questions; collect or acquire data; organize and represent data; and analyze data and communicate results) with...
- 3.PS.1
The student will apply the data cycle (formulate questions; collect or acquire data; organize and represent data; and analyze data and communicate results) with...
- 8.PS.3
The student will apply the data cycle (formulate questions; collect or acquire data; organize and represent data; and analyze data and communicate results) with...
Turn this cluster into a lesson
Grade, subject, topic, and the complete cluster are prefilled. Create one free, no account needed.
Also for this cluster:Make a WorksheetMake a QuizMake a Sub Lesson