Virginia SOL 7.PS.2.f
The Standard
Compare data represented in histograms with the same data represented in other graphs, including but not limited to line plots (dot plots), circle graphs, and stem-and-leaf plots, and justify which graphical representation best represents the data.
Virginia Standards of Learning for Mathematics · The student will apply the data cycle (formulate questions; collect or acquire data; organize and represent data; and analyze data and communicate results) with a focus on histograms.
Teacher's field guide
What This Standard Means
What Students Need to Do
- Students read the same data in a histogram and in a dot plot, circle graph, or stem-and-leaf plot. They compare what each display reveals, then select the best one for a stated purpose and support the choice with data.
What Mastery Looks Like
- A student accurately describes clusters, gaps, spread, frequencies, proportions, and individual values when the display allows it. The student chooses a graph based on the question and cites specific evidence from the displays.
Common Misconceptions
- Students may treat histogram bars as separate categories or assume each bar represents one value. They may claim exact values from a histogram even though values are grouped into intervals. Some choose the graph they like best without linking the choice to the question or data.
How to Assess It
- Give students a 12-value data set shown as a histogram and stem-and-leaf plot. Ask which display is better for finding the median and require one supporting reason.
Lesson moves
Ways to Teach It
Give groups 30 data cards and sticky notes to build a histogram and dot plot, then record two differences.
Students write which display best shows distribution shape and which preserves exact values, citing evidence from both.
Run a display match game where pairs connect data sets to histograms, dot plots, circle graphs, or stem-and-leaf plots and explain choices.
Compare class commute-time data in a histogram and stem-and-leaf plot, then choose the display best suited for advising bus schedules.
Free download
Printable 7.PS.2.f Worksheet
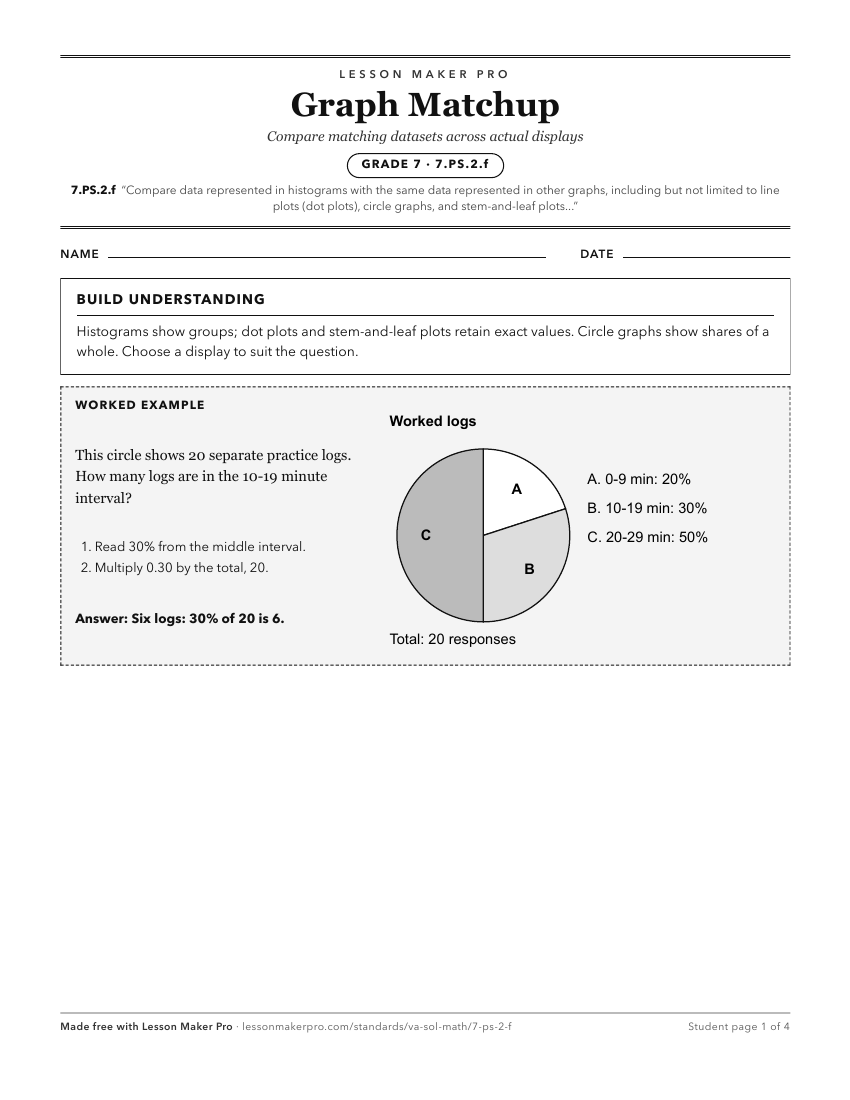
A ready-to-print activity worksheet aligned to 7.PS.2.f, with an answer key for the teacher on its own page. No account needed.
PDF, US Letter, prints cleanly in black and white.
Download the worksheetKeep exploring
Related Standards
- 7.PS.2.g
Analyze data represented in histograms by making observations and drawing conclusions. Determine how histograms reveal patterns in data that cannot be easily se...
- 8.PS.2.i
Given a contextual situation, justify which graphical representation (e.g., pictographs, bar graphs, line graphs, line plots/dot plots, stem-and-leaf plots, cir...
- 6.PS.1.f
Compare data represented in a circle graph with the same data represented in other graphs, including but not limited to bar graphs, pictographs, and line plots ...
- 8.PS.2.h
Compare and analyze two data sets represented in boxplots.
Turn this exact standard into a lesson
Grade, subject, topic, and the complete standard are prefilled. Create one free, no account needed.
Also for this standard:Make a WorksheetMake a QuizMake a Sub Lesson