Virginia SOL 8.PS.2.h
The Standard
Compare and analyze two data sets represented in boxplots.
Virginia Standards of Learning for Mathematics · The student will apply the data cycle (formulate questions; collect or acquire data; organize and represent data; and analyze data and communicate results) with a focus on boxplots.
Teacher's field guide
What This Standard Means
What Students Need to Do
- Students read medians, quartiles, ranges, and interquartile ranges from boxplots drawn on the same scale. They compare typical values and variability, then justify conclusions with numerical evidence.
What Mastery Looks Like
- A student correctly identifies each median, quartile, range, and interquartile range. The student compares center and spread, then supports a conclusion with values from both plots.
Common Misconceptions
- Students may treat the box edges as the minimum and maximum or assume the line inside the box is the mean. They may compare only medians and ignore spread, overlap, or different number-line scales.
How to Assess It
- Give students two boxplots and ask: Which group has the higher typical value, and which is more consistent? Require two numerical facts as evidence.
Lesson moves
Ways to Teach It
Give pairs data cards, then have students order the values, find five-number summaries, build boxplots, and compare the groups.
Ask students to write which group is typically higher and which varies more, using at least two boxplot values as evidence.
Play Boxplot Match by having teams pair data summaries with boxplots, then explain each match using median, quartiles, and range.
Compare boxplots of two sports teams' game scores and decide which team performs better and which is more consistent.
Free download
Printable 8.PS.2.h Worksheet
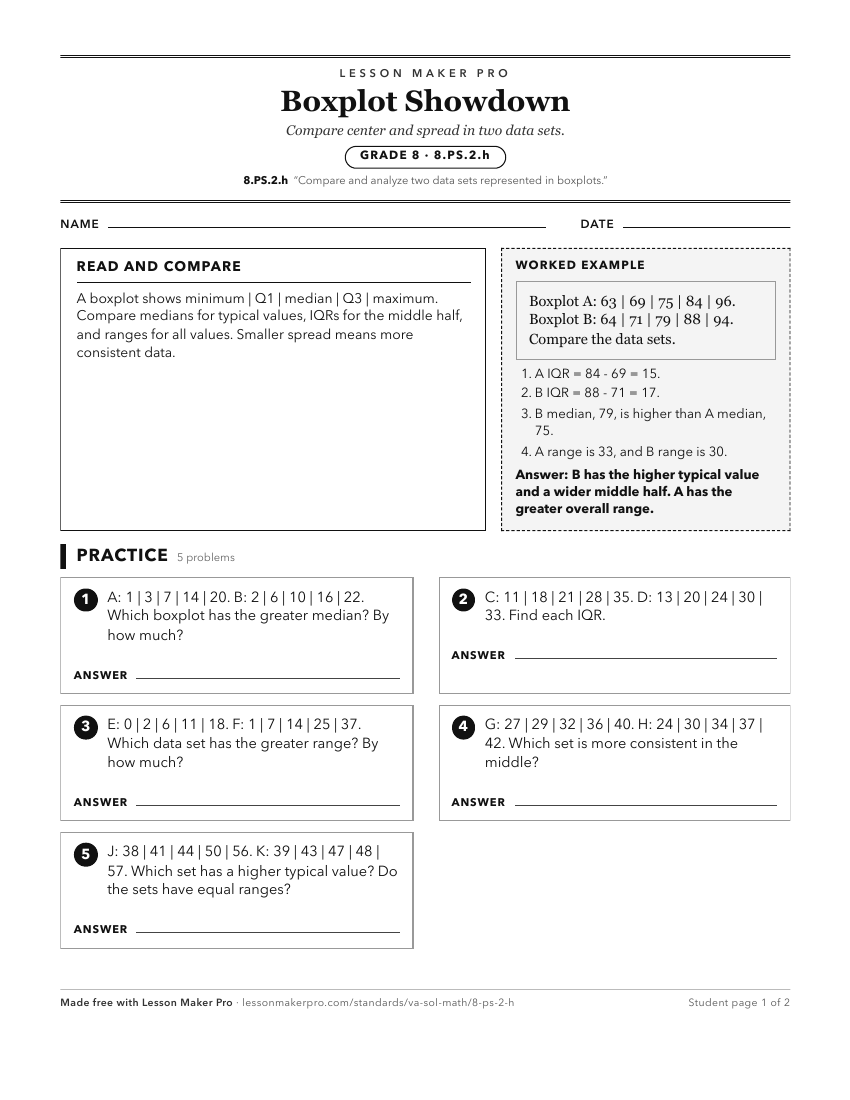
A ready-to-print activity worksheet aligned to 8.PS.2.h, with an answer key for the teacher on its own page. No account needed.
PDF, US Letter, prints cleanly in black and white.
Download the worksheetKeep exploring
Related Standards
- 8.PS.2.g
Analyze data represented in a boxplot by making observations and drawing conclusions.
- 7.PS.2.f
Compare data represented in histograms with the same data represented in other graphs, including but not limited to line plots (dot plots), circle graphs, and s...
- 6.PS.1.f
Compare data represented in a circle graph with the same data represented in other graphs, including but not limited to bar graphs, pictographs, and line plots ...
- 8.PS.3.e
Analyze and justify the relationship of the quantitative bivariate data represented in scatterplots.
Turn this exact standard into a lesson
Grade, subject, topic, and the complete standard are prefilled. Create one free, no account needed.
Also for this standard:Make a WorksheetMake a QuizMake a Sub Lesson