Virginia SOL 8.PS.2.g
The Standard
Analyze data represented in a boxplot by making observations and drawing conclusions.
Virginia Standards of Learning for Mathematics · The student will apply the data cycle (formulate questions; collect or acquire data; organize and represent data; and analyze data and communicate results) with a focus on boxplots.
Teacher's field guide
What This Standard Means
What Students Need to Do
- Students read the minimum, lower quartile, median, upper quartile, and maximum from a boxplot. They use those values to describe center, spread, clustering, and possible skew, then make claims supported by the display.
What Mastery Looks Like
- A student accurately identifies the five-number summary and calculates the range and interquartile range. The student recognizes that each quartile contains about 25 percent of the data and supports a context-based claim with plotted values.
Common Misconceptions
- Students often think longer box sections contain more data, rather than the same proportion spread across a wider interval. They may confuse the median with the mean or claim exact frequencies and individual values that the plot does not show.
How to Assess It
- Display a boxplot of daily reading minutes with a minimum of 4, Q1 of 7, median of 9, Q3 of 15, and maximum of 18. Ask students to find the IQR and explain what it says about the middle half of the data.
Lesson moves
Ways to Teach It
Give pairs five-number-summary cards and yarn; students build floor boxplots, then explain what each segment says about spread.
Prompt students: Two box sections have different lengths; do they contain different numbers of data points? Defend your answer.
Run a boxplot detective game where teams earn points for accurate claims about median, IQR, range, and skew.
Compare boxplots of bus arrival times for two routes and choose the more predictable route using median and IQR.
Free download
Printable 8.PS.2.g Worksheet
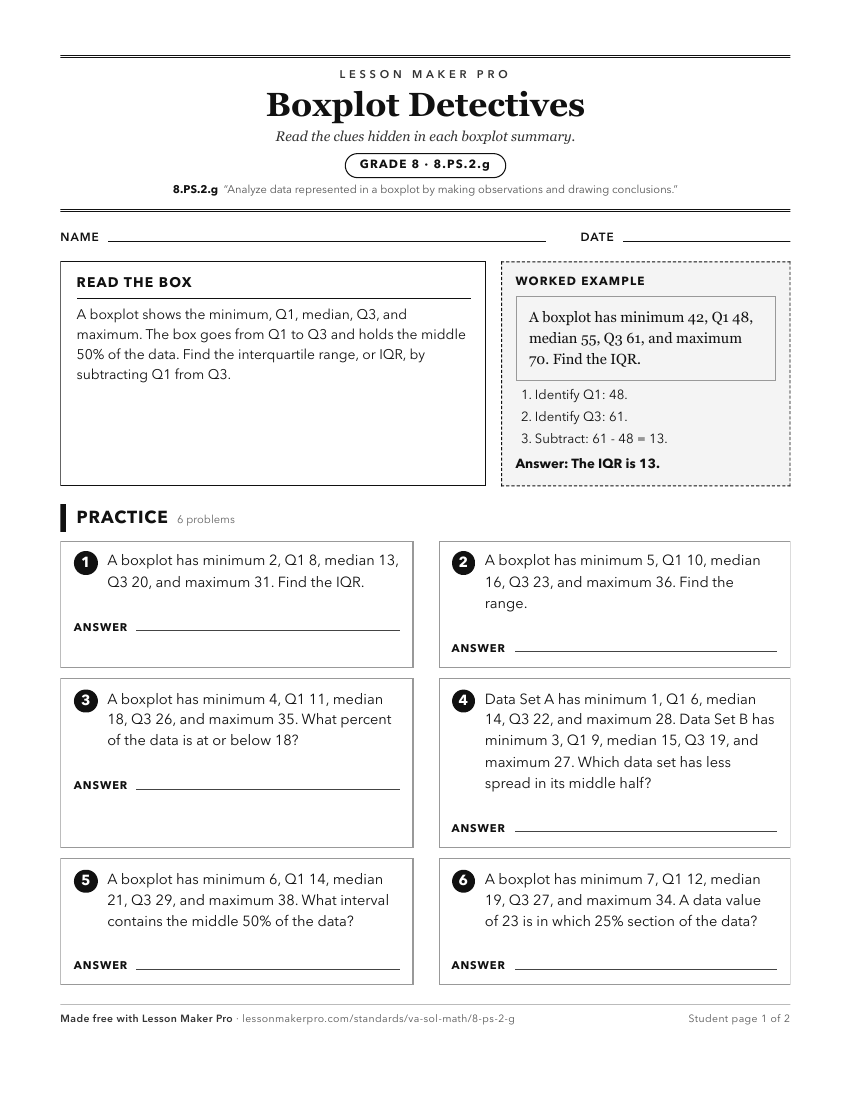
A ready-to-print activity worksheet aligned to 8.PS.2.g, with an answer key for the teacher on its own page. No account needed.
PDF, US Letter, prints cleanly in black and white.
Download the worksheetKeep exploring
Related Standards
- 7.PS.2.g
Analyze data represented in histograms by making observations and drawing conclusions. Determine how histograms reveal patterns in data that cannot be easily se...
- 8.PS.2.a
Formulate questions that require the collection or acquisition of data with a focus on boxplots.
- 6.PS.1.e
Analyze data represented in a circle graph by making observations and drawing conclusions.
- 8.PS.2.h
Compare and analyze two data sets represented in boxplots.
Turn this exact standard into a lesson
Grade, subject, topic, and the complete standard are prefilled. Create one free, no account needed.
Also for this standard:Make a WorksheetMake a QuizMake a Sub Lesson