Virginia SOL 6.PS.1.e
The Standard
Analyze data represented in a circle graph by making observations and drawing conclusions.
Virginia Standards of Learning for Mathematics · The student will apply the data cycle (formulate questions; collect or acquire data; organize and represent data; and analyze data and communicate results) with a focus on circle graphs.
Teacher's field guide
What This Standard Means
What Students Need to Do
- Students read category labels, sector sizes, percentages, and the graph title. They compare parts of the whole, identify patterns, and support a reasonable conclusion with graph values.
What Mastery Looks Like
- A student accurately identifies the largest and smallest categories and compares shares using labels or percentages. The student states a conclusion that fits the data and explains what the graph cannot show.
Common Misconceptions
- Students may compare colors instead of sector sizes, labels, and percentages. They may treat a percentage as a count, forget that sectors total 100%, or claim the graph proves a cause.
How to Assess It
- Show how 200 sixth graders travel to school: 40% bus, 25% car, 20% walk, and 15% bike. Ask students to write two observations and one conclusion, citing graph values.
Lesson moves
Ways to Teach It
Give pairs a paper circle graph and 24 counters, then have them model each sector and write two supported comparisons.
Display a lunch preference circle graph and ask, “Which claim is best supported, and what labels or sector sizes prove it?”
Play Claim or Guess: teams sort statements about circle graphs into supported conclusions or claims the graph cannot prove.
Use a school budget circle graph to identify which category receives the most funding and explain one limit of that conclusion.
Free download
Printable 6.PS.1.e Worksheet
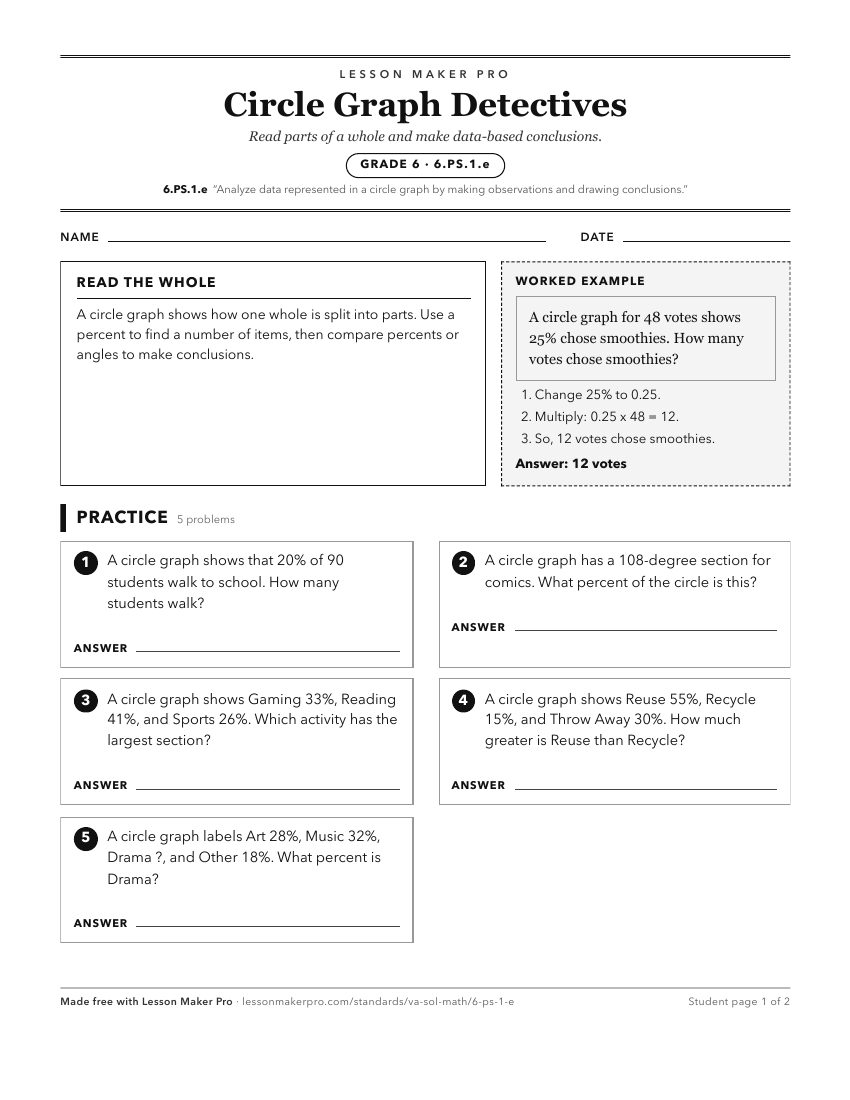
A ready-to-print activity worksheet aligned to 6.PS.1.e, with an answer key for the teacher on its own page. No account needed.
PDF, US Letter, prints cleanly in black and white.
Download the worksheetKeep exploring
Related Standards
- 8.PS.2.g
Analyze data represented in a boxplot by making observations and drawing conclusions.
- 7.PS.2.g
Analyze data represented in histograms by making observations and drawing conclusions. Determine how histograms reveal patterns in data that cannot be easily se...
- 6.PS.1
The student will apply the data cycle (formulate questions; collect or acquire data; organize and represent data; and analyze data and communicate results) with...
- 6.PS.1.f
Compare data represented in a circle graph with the same data represented in other graphs, including but not limited to bar graphs, pictographs, and line plots ...
Turn this exact standard into a lesson
Grade, subject, topic, and the complete standard are prefilled. Create one free, no account needed.
Also for this standard:Make a WorksheetMake a QuizMake a Sub Lesson