Virginia SOL 6.PS.1
SOL Standard (Knowledge and Skills Cluster)
The student will apply the data cycle (formulate questions; collect or acquire data; organize and represent data; and analyze data and communicate results) with a focus on circle graphs.
Virginia Standards of Learning for Mathematics
Cluster contents
Knowledge and Skills in This Standard
6.PS.1 is a Standards of Learning standard. These are the knowledge and skills expectations under it.
- 6.PS.1.a
Formulate questions that require the collection or acquisition of data with a focus on circle graphs.
- 6.PS.1.b
Determine the data needed to answer a formulated question and collect the data (or acquire existing data) using various methods (e.g., observations, measurement...
- 6.PS.1.c
Determine the factors that will ensure that the data collected is a sample that is representative of a larger population.
- 6.PS.1.d
Organize and represent data using circle graphs, with and without the use of technology tools. The number of data values should be limited to allow for comparis...
- 6.PS.1.e
Analyze data represented in a circle graph by making observations and drawing conclusions.
- 6.PS.1.f
Compare data represented in a circle graph with the same data represented in other graphs, including but not limited to bar graphs, pictographs, and line plots ...
Teacher's field guide
What This Cluster Means
What Students Need to Do
- Students ask a question, choose needed data, and collect a representative sample. They organize the results in a circle graph, interpret the graph, and compare it with other graph types.
What Mastery Looks Like
- Students collect suitable data, calculate each category’s fraction or percent, and create an accurate circle graph. They draw supported conclusions and explain whether a circle graph or another graph shows the data more clearly.
Common Misconceptions
- Students may size each sector from the category count instead of its fraction of the total. They may create percentages that do not total 100 percent. They may assume a large convenience sample represents the whole population.
How to Assess It
- Give this exit ticket: “Of 20 students, 7 chose apples, 6 bananas, 4 grapes, and 3 oranges. Draw a labeled circle graph and write one conclusion.”
Lesson moves
Ways to Teach It
Fold a paper circle into 12 equal sectors, then color sectors to represent responses from a 12-student classroom survey.
Ask, “When would a bar graph show survey results better than a circle graph?” Students defend their choice with one example.
Give teams category cards with counts; teams race to match each data set to the correct circle graph and explain each match.
Use a school lunch menu survey to create a circle graph showing meal preferences and discuss whether the sample represents the whole school.
Free download
Printable 6.PS.1 Worksheet
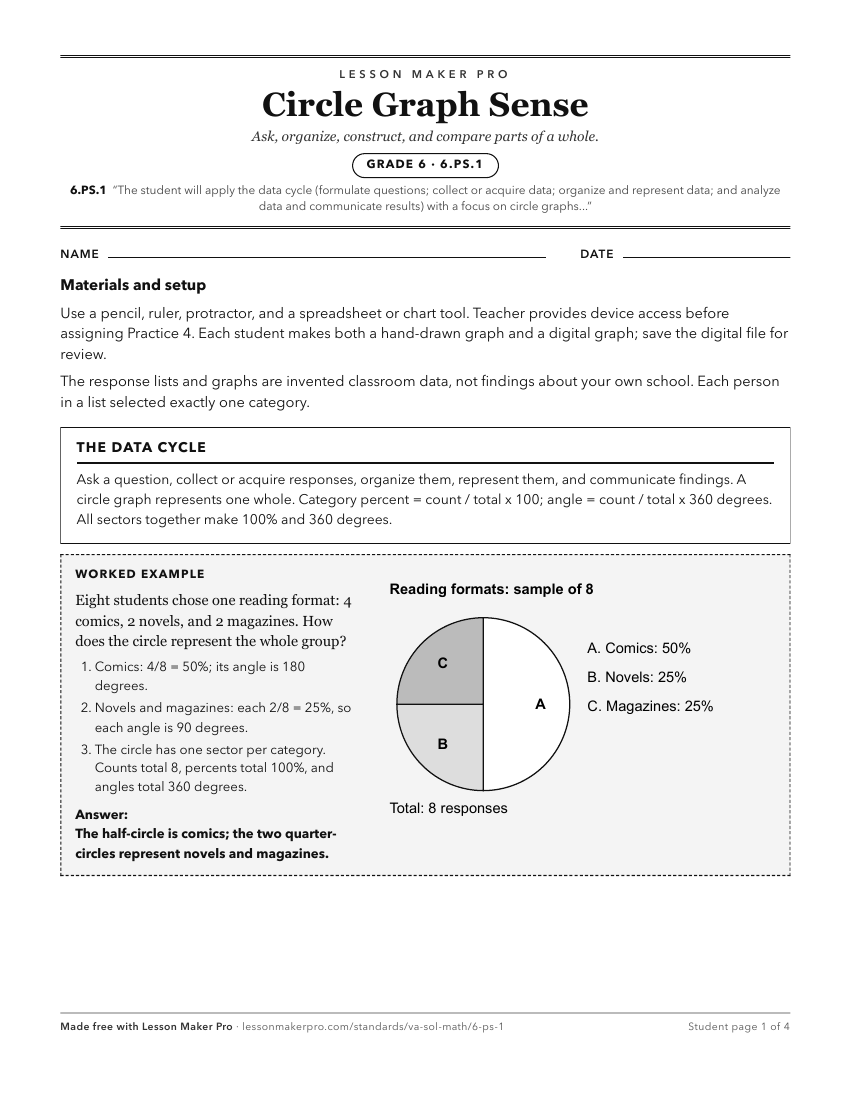
A ready-to-print activity worksheet aligned to 6.PS.1, with an answer key for the teacher on its own page. No account needed.
PDF, US Letter, prints cleanly in black and white.
Download the worksheetKeep exploring
Related Standards
- 4.PS.1
The student will apply the data cycle (formulate questions; collect or acquire data; organize and represent data; and analyze data and communicate results) with...
- 1.PS.1
The student will apply the data cycle (pose questions; collect or acquire data; organize and represent data; and analyze data and communicate results) with a fo...
- K.PS.1
The student will apply the data cycle (pose questions; collect or acquire data; organize and represent data; and analyze data and communicate results) with a fo...
- 8.PS.3
The student will apply the data cycle (formulate questions; collect or acquire data; organize and represent data; and analyze data and communicate results) with...
Turn this cluster into a lesson
Grade, subject, topic, and the complete cluster are prefilled. Create one free, no account needed.
Also for this cluster:Make a WorksheetMake a QuizMake a Sub Lesson