Virginia SOL 8.PS.3
SOL Standard (Knowledge and Skills Cluster)
The student will apply the data cycle (formulate questions; collect or acquire data; organize and represent data; and analyze data and communicate results) with a focus on scatterplots.
Virginia Standards of Learning for Mathematics
Cluster contents
Knowledge and Skills in This Standard
8.PS.3 is a Standards of Learning standard. These are the knowledge and skills expectations under it.
- 8.PS.3.a
Formulate questions that require the collection or acquisition of data with a focus on scatterplots.
- 8.PS.3.b
Determine the data needed to answer a formulated question and collect the data (or acquire existing data) of no more than 20 items using various methods (e.g., ...
- 8.PS.3.c
Organize and represent numeric bivariate data using scatterplots with and without the use of technology.
- 8.PS.3.d
Make observations about a set of data points in a scatterplot as having a positive linear relationship, a negative linear relationship, or no relationship
- 8.PS.3.e
Analyze and justify the relationship of the quantitative bivariate data represented in scatterplots.
- 8.PS.3.f
Sketch the line of best fit for data represented in a scatterplot.
Teacher's field guide
What This Cluster Means
What Students Need to Do
- Students ask a question that can be answered with paired numerical data, then gather or find up to 20 data pairs. They make a scatterplot, describe its relationship, justify their conclusion, and sketch a reasonable line of best fit.
What Mastery Looks Like
- Students collect or use up to 20 paired numerical values and plot each pair accurately. They identify positive, negative, or no relationship, then sketch a line that balances the points and explain the pattern.
Common Misconceptions
- Students may reverse the variables on the axes or separate paired values when plotting. They may call any upward pattern positive, treat association as causation, or connect points instead of drawing a balanced line of best fit.
How to Assess It
- Give students eight ordered pairs and ask them to make a scatterplot, name the relationship, sketch a line of best fit, and justify their choice.
Lesson moves
Ways to Teach It
Measure hand span and height for 15 classmates, plot the paired data, describe the relationship, and draw a line of best fit.
Show a scatterplot and ask, "What claim does the graph support, and what claim would go beyond the evidence?"
Give teams scatterplot cards to sort into positive, negative, or no relationship, then require one written reason for each choice.
Use 14 days of temperature and electricity-use data to investigate whether hotter days are associated with greater electricity use.
Free download
Printable 8.PS.3 Worksheet
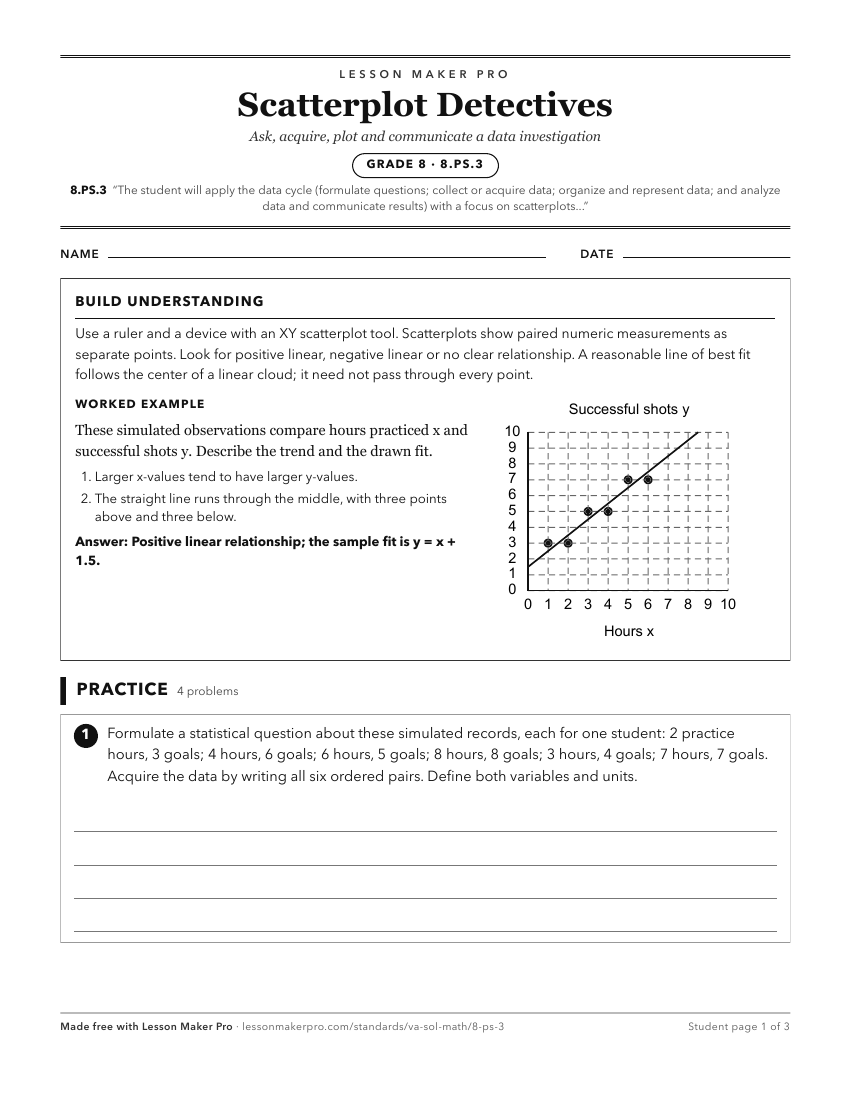
A ready-to-print activity worksheet aligned to 8.PS.3, with an answer key for the teacher on its own page. No account needed.
PDF, US Letter, prints cleanly in black and white.
Download the worksheetKeep exploring
Related Standards
- 8.PS.2
The student will apply the data cycle (formulate questions; collect or acquire data; organize and represent data; and analyze data and communicate results) with...
- 1.PS.1
The student will apply the data cycle (pose questions; collect or acquire data; organize and represent data; and analyze data and communicate results) with a fo...
- 5.PS.1
The student will apply the data cycle (formulate questions; collect or acquire data; organize and represent data; and analyze data and communicate results) with...
- 6.PS.1
The student will apply the data cycle (formulate questions; collect or acquire data; organize and represent data; and analyze data and communicate results) with...
Turn this cluster into a lesson
Grade, subject, topic, and the complete cluster are prefilled. Create one free, no account needed.
Also for this cluster:Make a WorksheetMake a QuizMake a Sub Lesson